Create Metrics
Overview
Building a health scorecard (Metrics) for an organization has many important benefits.
- First, it helps the organization evaluate the effectiveness of activities and strategies.
- Second, the Metrics allows tracking progress and measuring growth over time.
- Third, it provides important information for strategic direction.
- Fourth, the Metrics is a powerful communication tool to convey information about organizational health to stakeholders.
- Finally, it encourages continuous improvement by setting goals and tracking progress.
Create Metrics
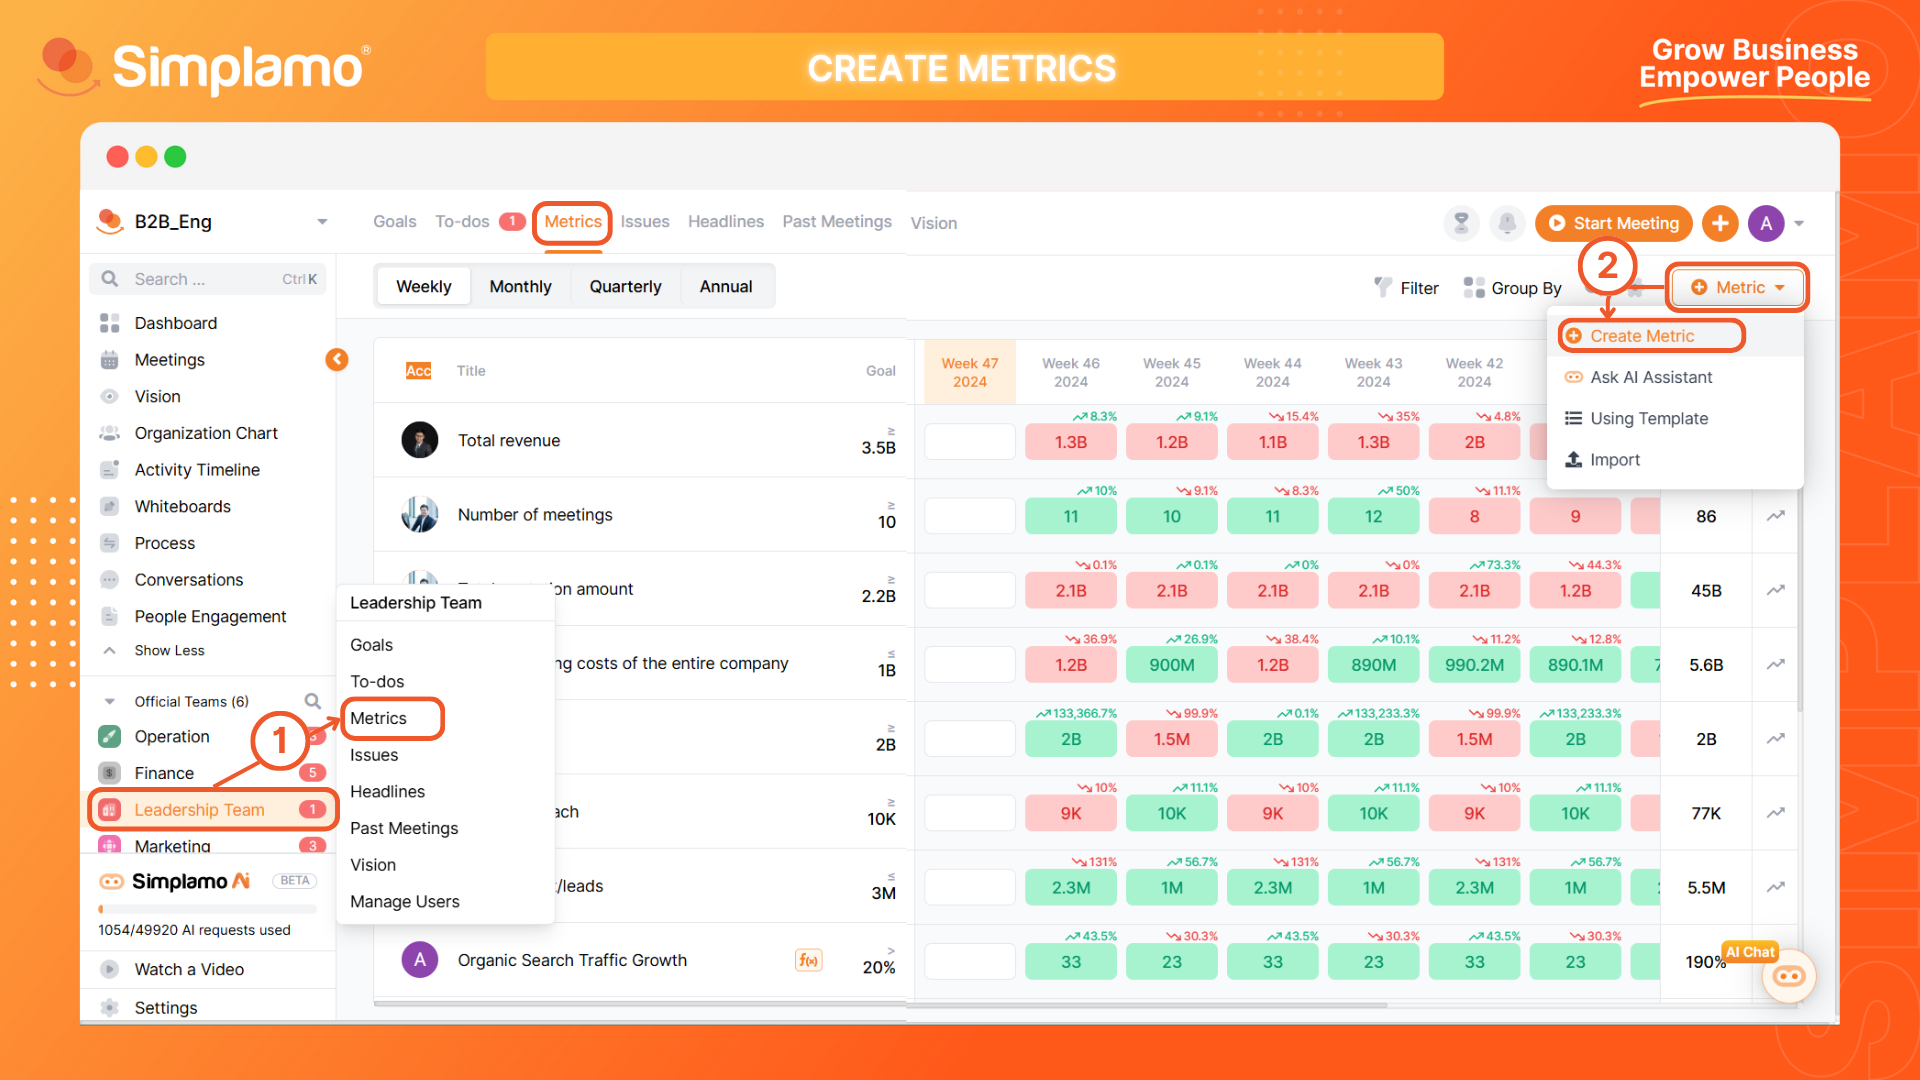
Step 1: Select team
Select the team to create the Metrics for. In case of creating Company-level Metrics, select "Leadership team".
Continue by clicking the "Create Metrics" button.
Step 2: Create Metrics
Select "Create Metrics" to create a new metric. Each metric is a key activity demonstrating work results within a specific timeframe.
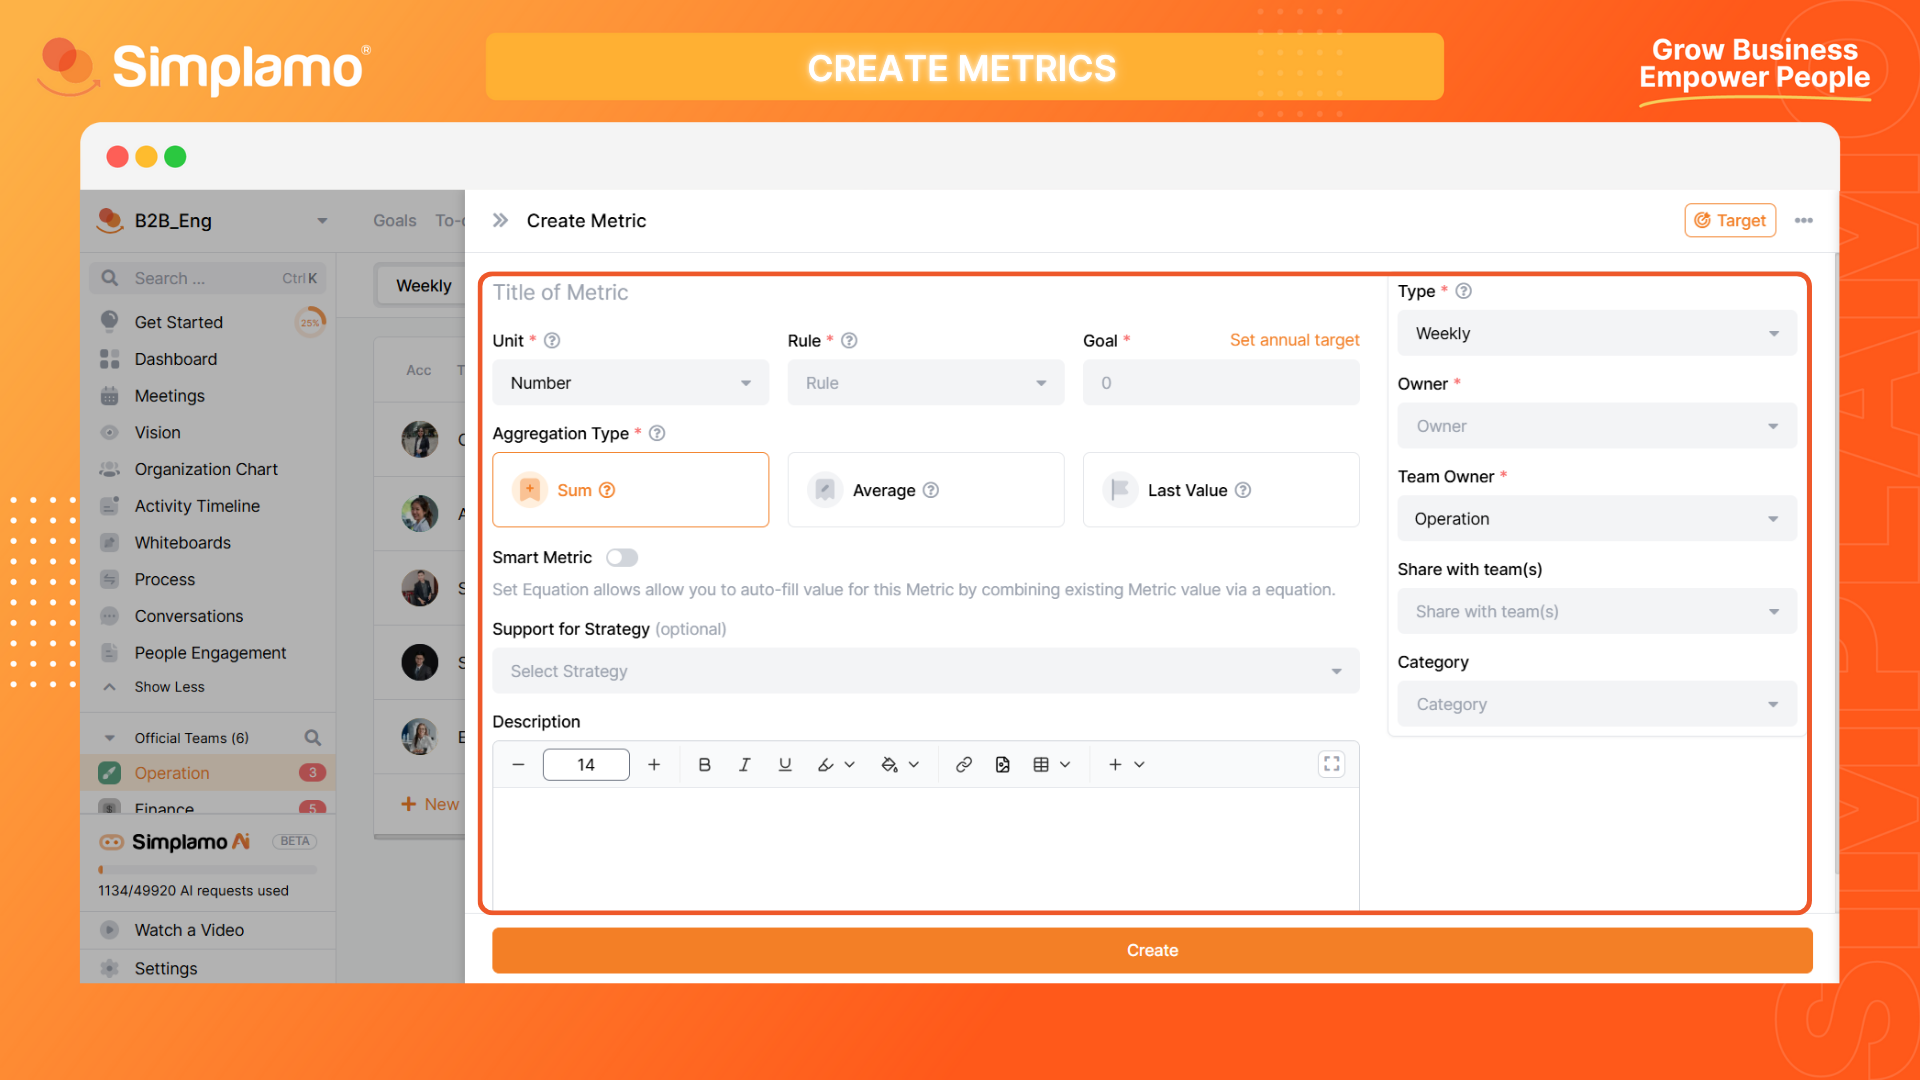
- Fill in the metric name in the "Title" field.
- The metric "Type" is defaulted to "Weekly" for review during weekly meetings. However, you can also set it to Monthly, Quarterly, or Yearly depending on your needs.
- Select the appropriate "Unit" for measurement. There are 3 types of measurement: Measurement by "Number", by "Percentage", or by "Currency".
- Set targets for each metric based on the established plan and fill them in the "Target" field.
- Identify the person responsible for each metric based on the Responsibility Assignment Matrix and select their account in the "Owner" field.
- Select the owning group for this metric.
- Grouping metrics with the same "Category" together will help the organization classify metrics, create data structure, evaluate relationships, and plan effectively.
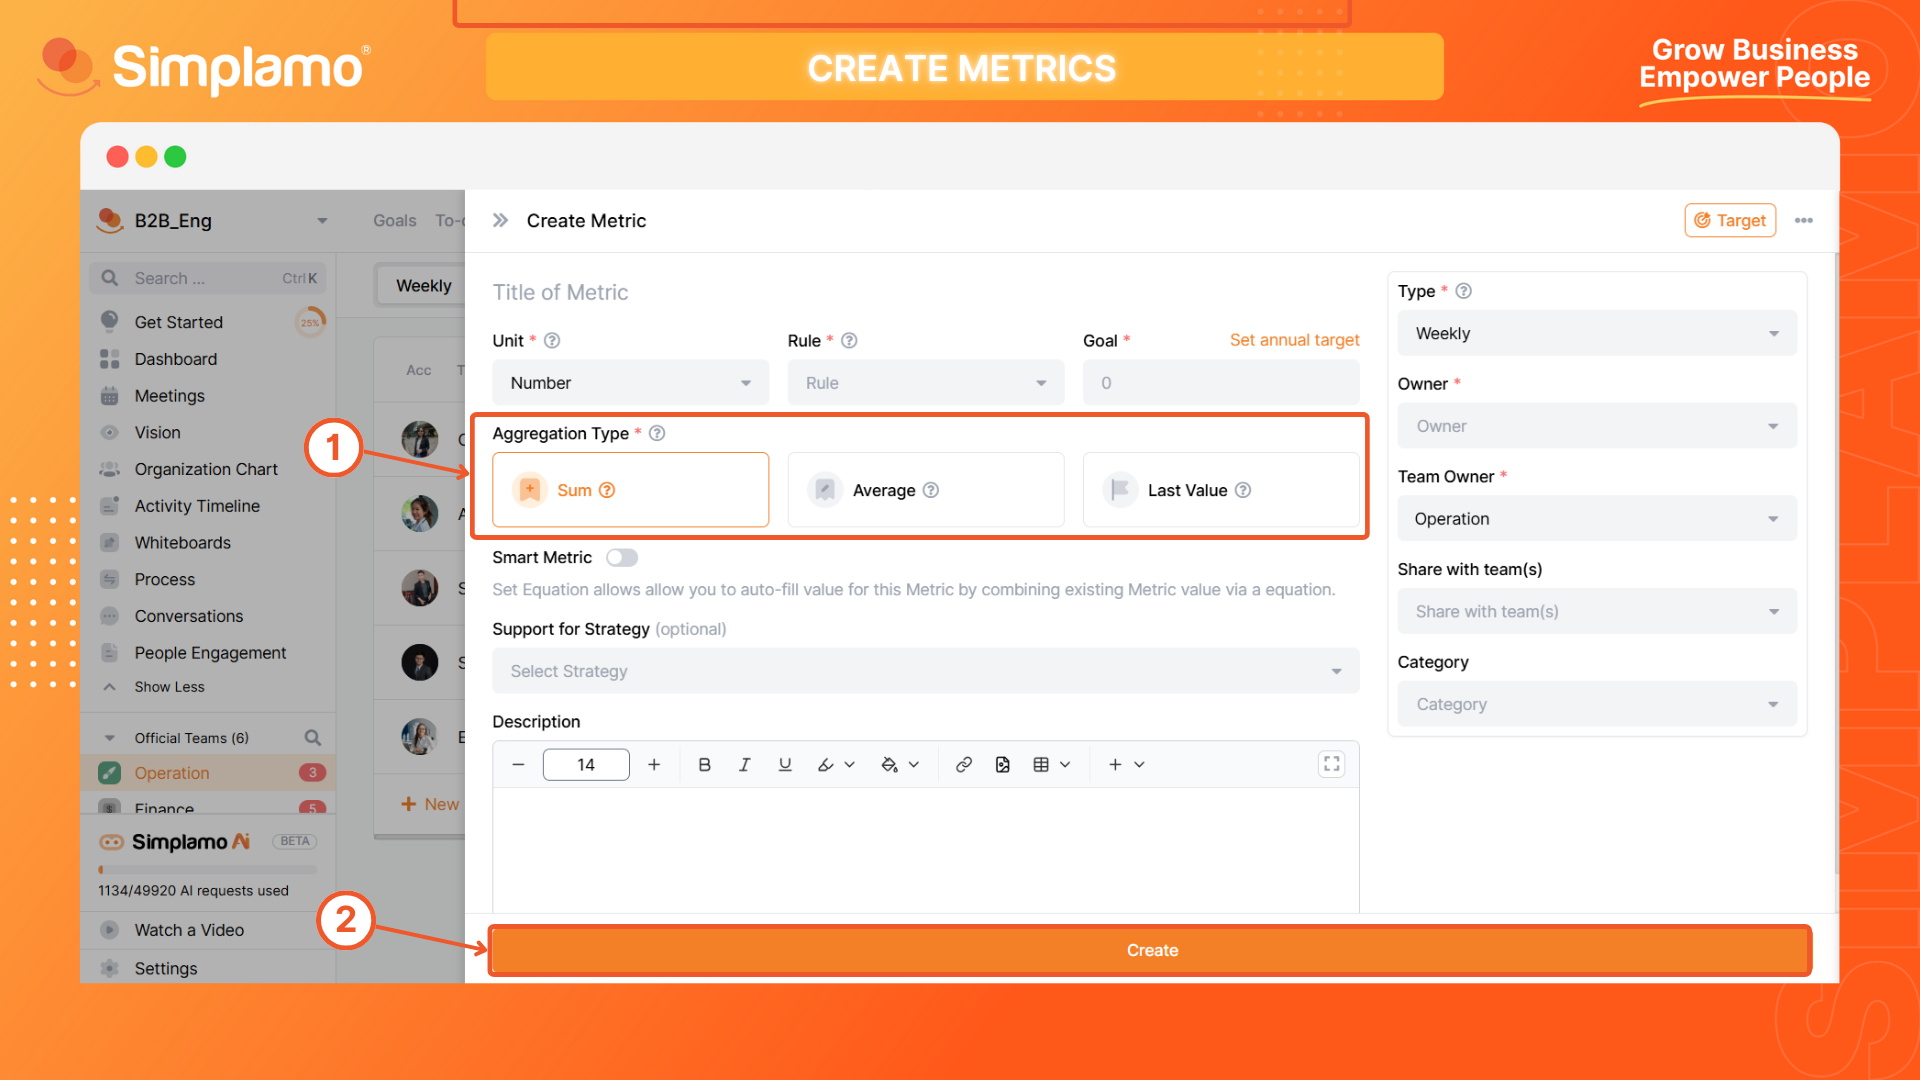
Step 3: Select Aggregation Type
Next, we need to select the aggregation type for the Metric.
There are 3 forms displayed in the "Aggregation Type" field as follows (1):
- Summation: The metric will be cumulatively added each week to give the final result aggregated by month, quarter, or year. Suitable for metrics related to quantity, revenue, etc.
- Average: The metric will be calculated as the average of each week to give the final result and aggregated by month, quarter, or year. Suitable for metrics measuring ratios, etc.
- Final Value: Displays the final value for targets that constantly increase over time. Suitable for metrics measuring cash flow, debt recovery, etc.
Finally, select the "Create" (2) button.
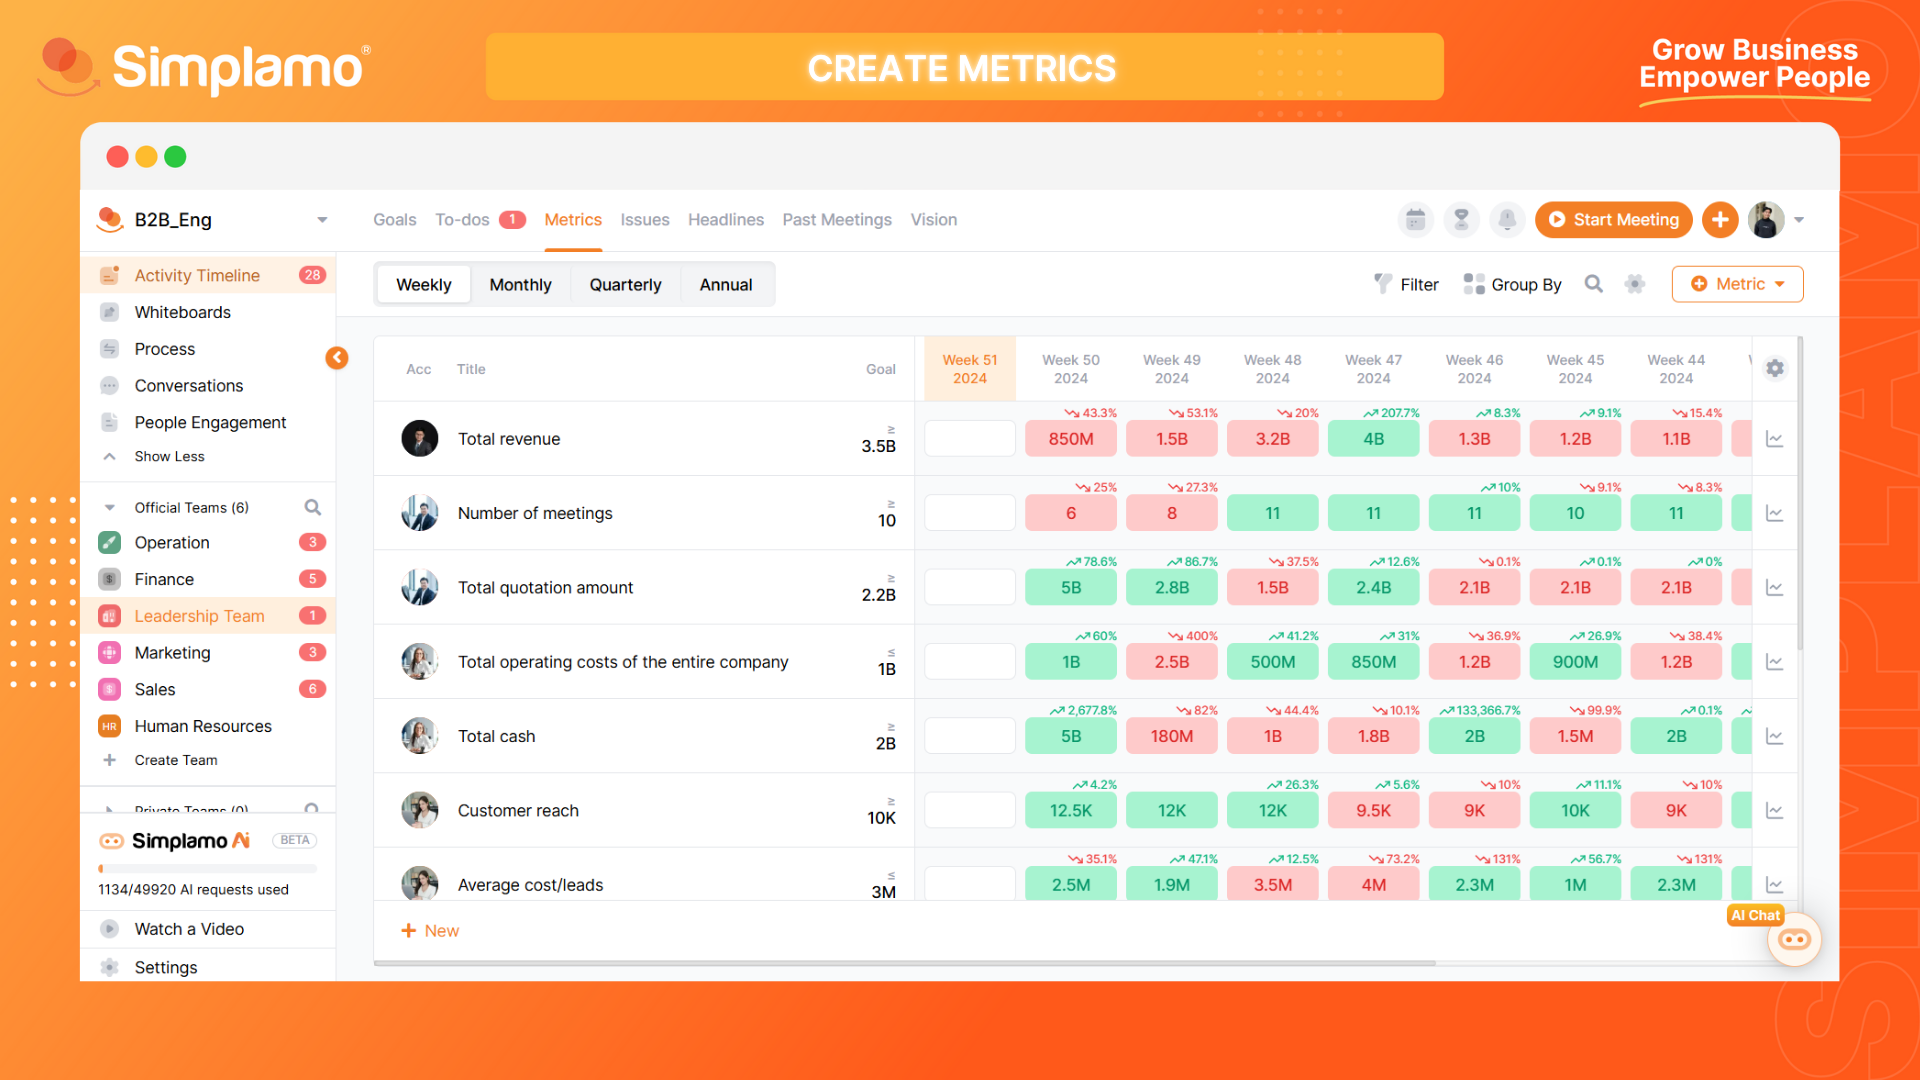
Note: The rule of thumb for success is to have only 5 to 15 metrics in the Weekly Metrics Table to ensure that you are focusing on the most critical activities of the entire business.
**Note: The key to success is to have only 5 to 15 metrics* in the Metrics to ensure that you are closely monitoring the most critical activities of the business.
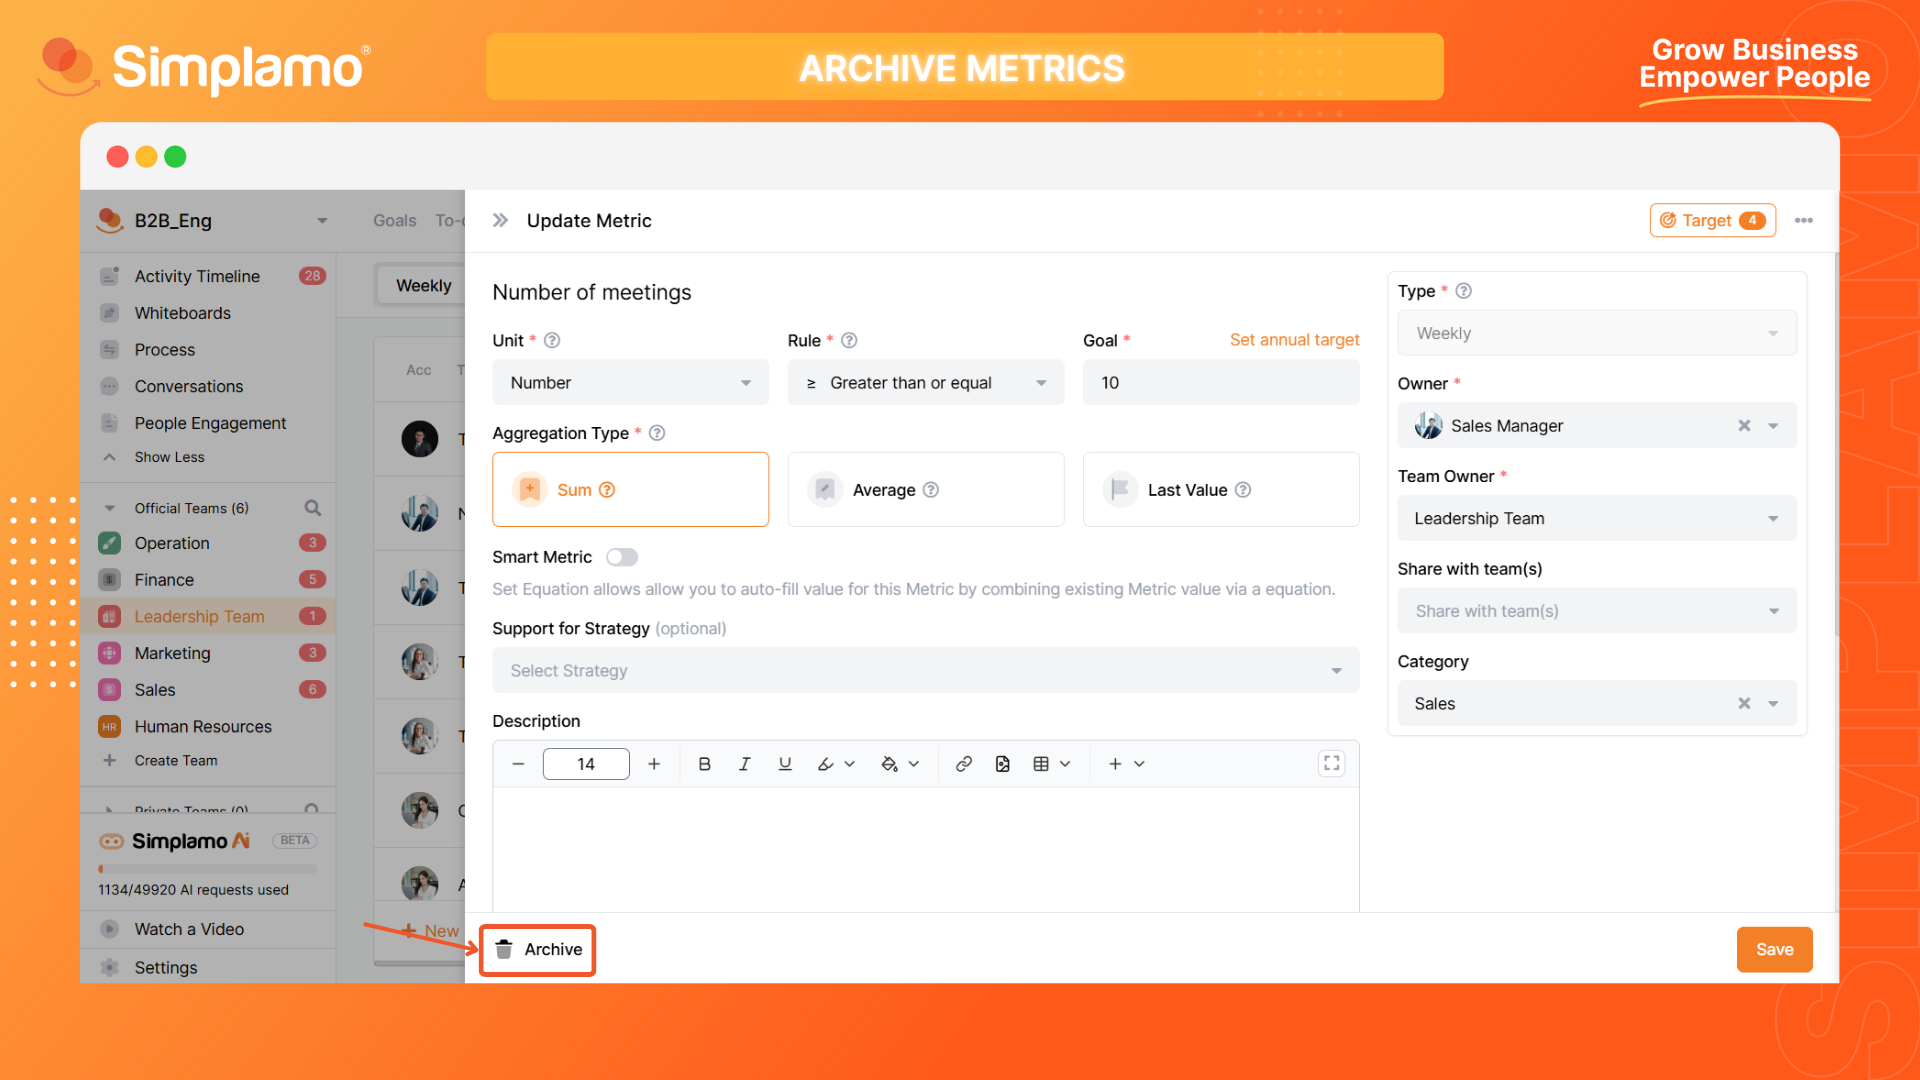
Archive Metrics
Archiving Metrics aims to consolidate current data without losing past data. You can review archived data to conduct comparisons, evaluations, analyses, and propose improvement plans.
Step 1: Identify and select the metric to "Archive".
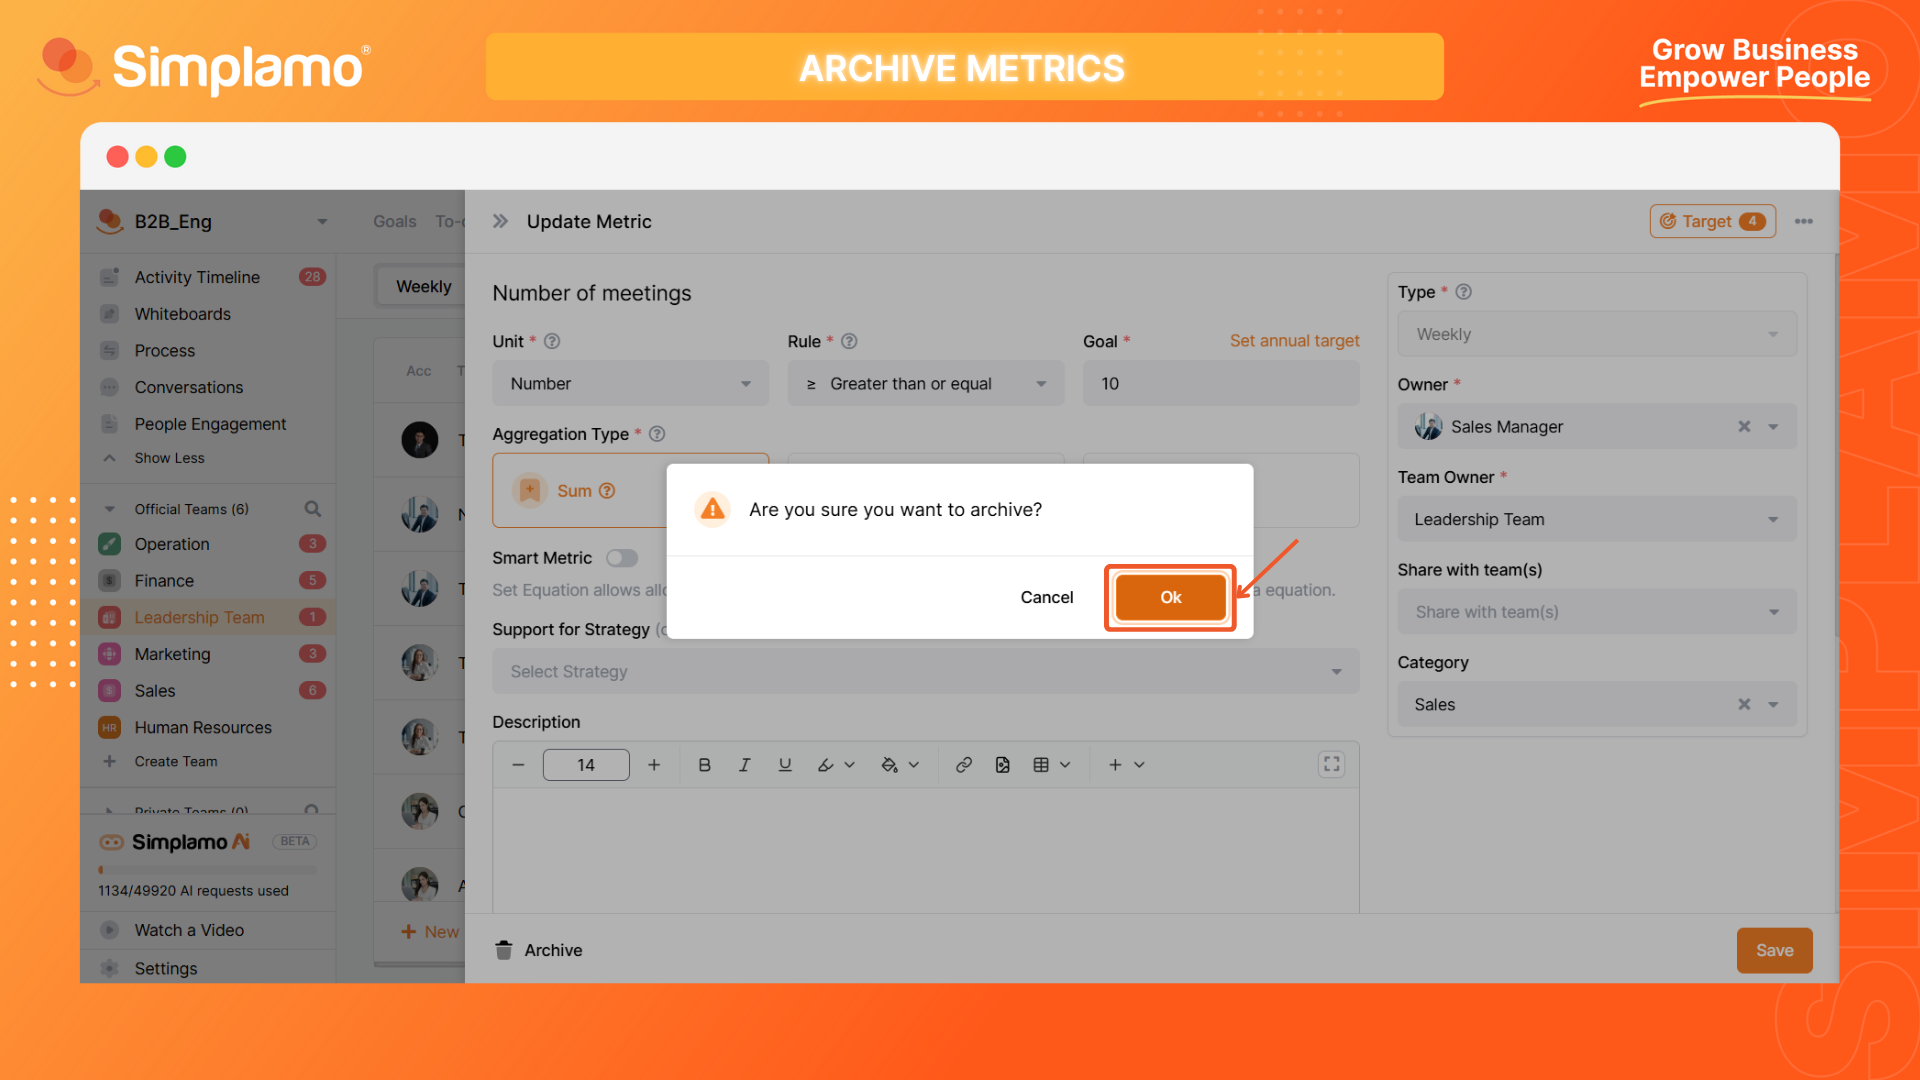
Step 2: On the metric adjustment screen, select the "Archive" feature and click "OK" to complete archiving the metric.
Note: When performing metric archiving, ensure you have the consensus of the team and leadership.
So, you have successfully completed setting up an effective business Metrics on Simplamo.
Let keep track of the actual weekly data on the Metrics by conducting your weekly meetings.