Filter and Group Metrics
Overview
Filtering/Grouping metrics is valuable for understanding and effectively using information.
By filtering metrics, we focus on the most important information, eliminating unnecessary data, and helping us grasp the overall picture efficiently.
Grouping metrics allows us to identify patterns, trends, and relationships between metrics, supporting insightful conclusions and guiding actions.
Grouping Metrics
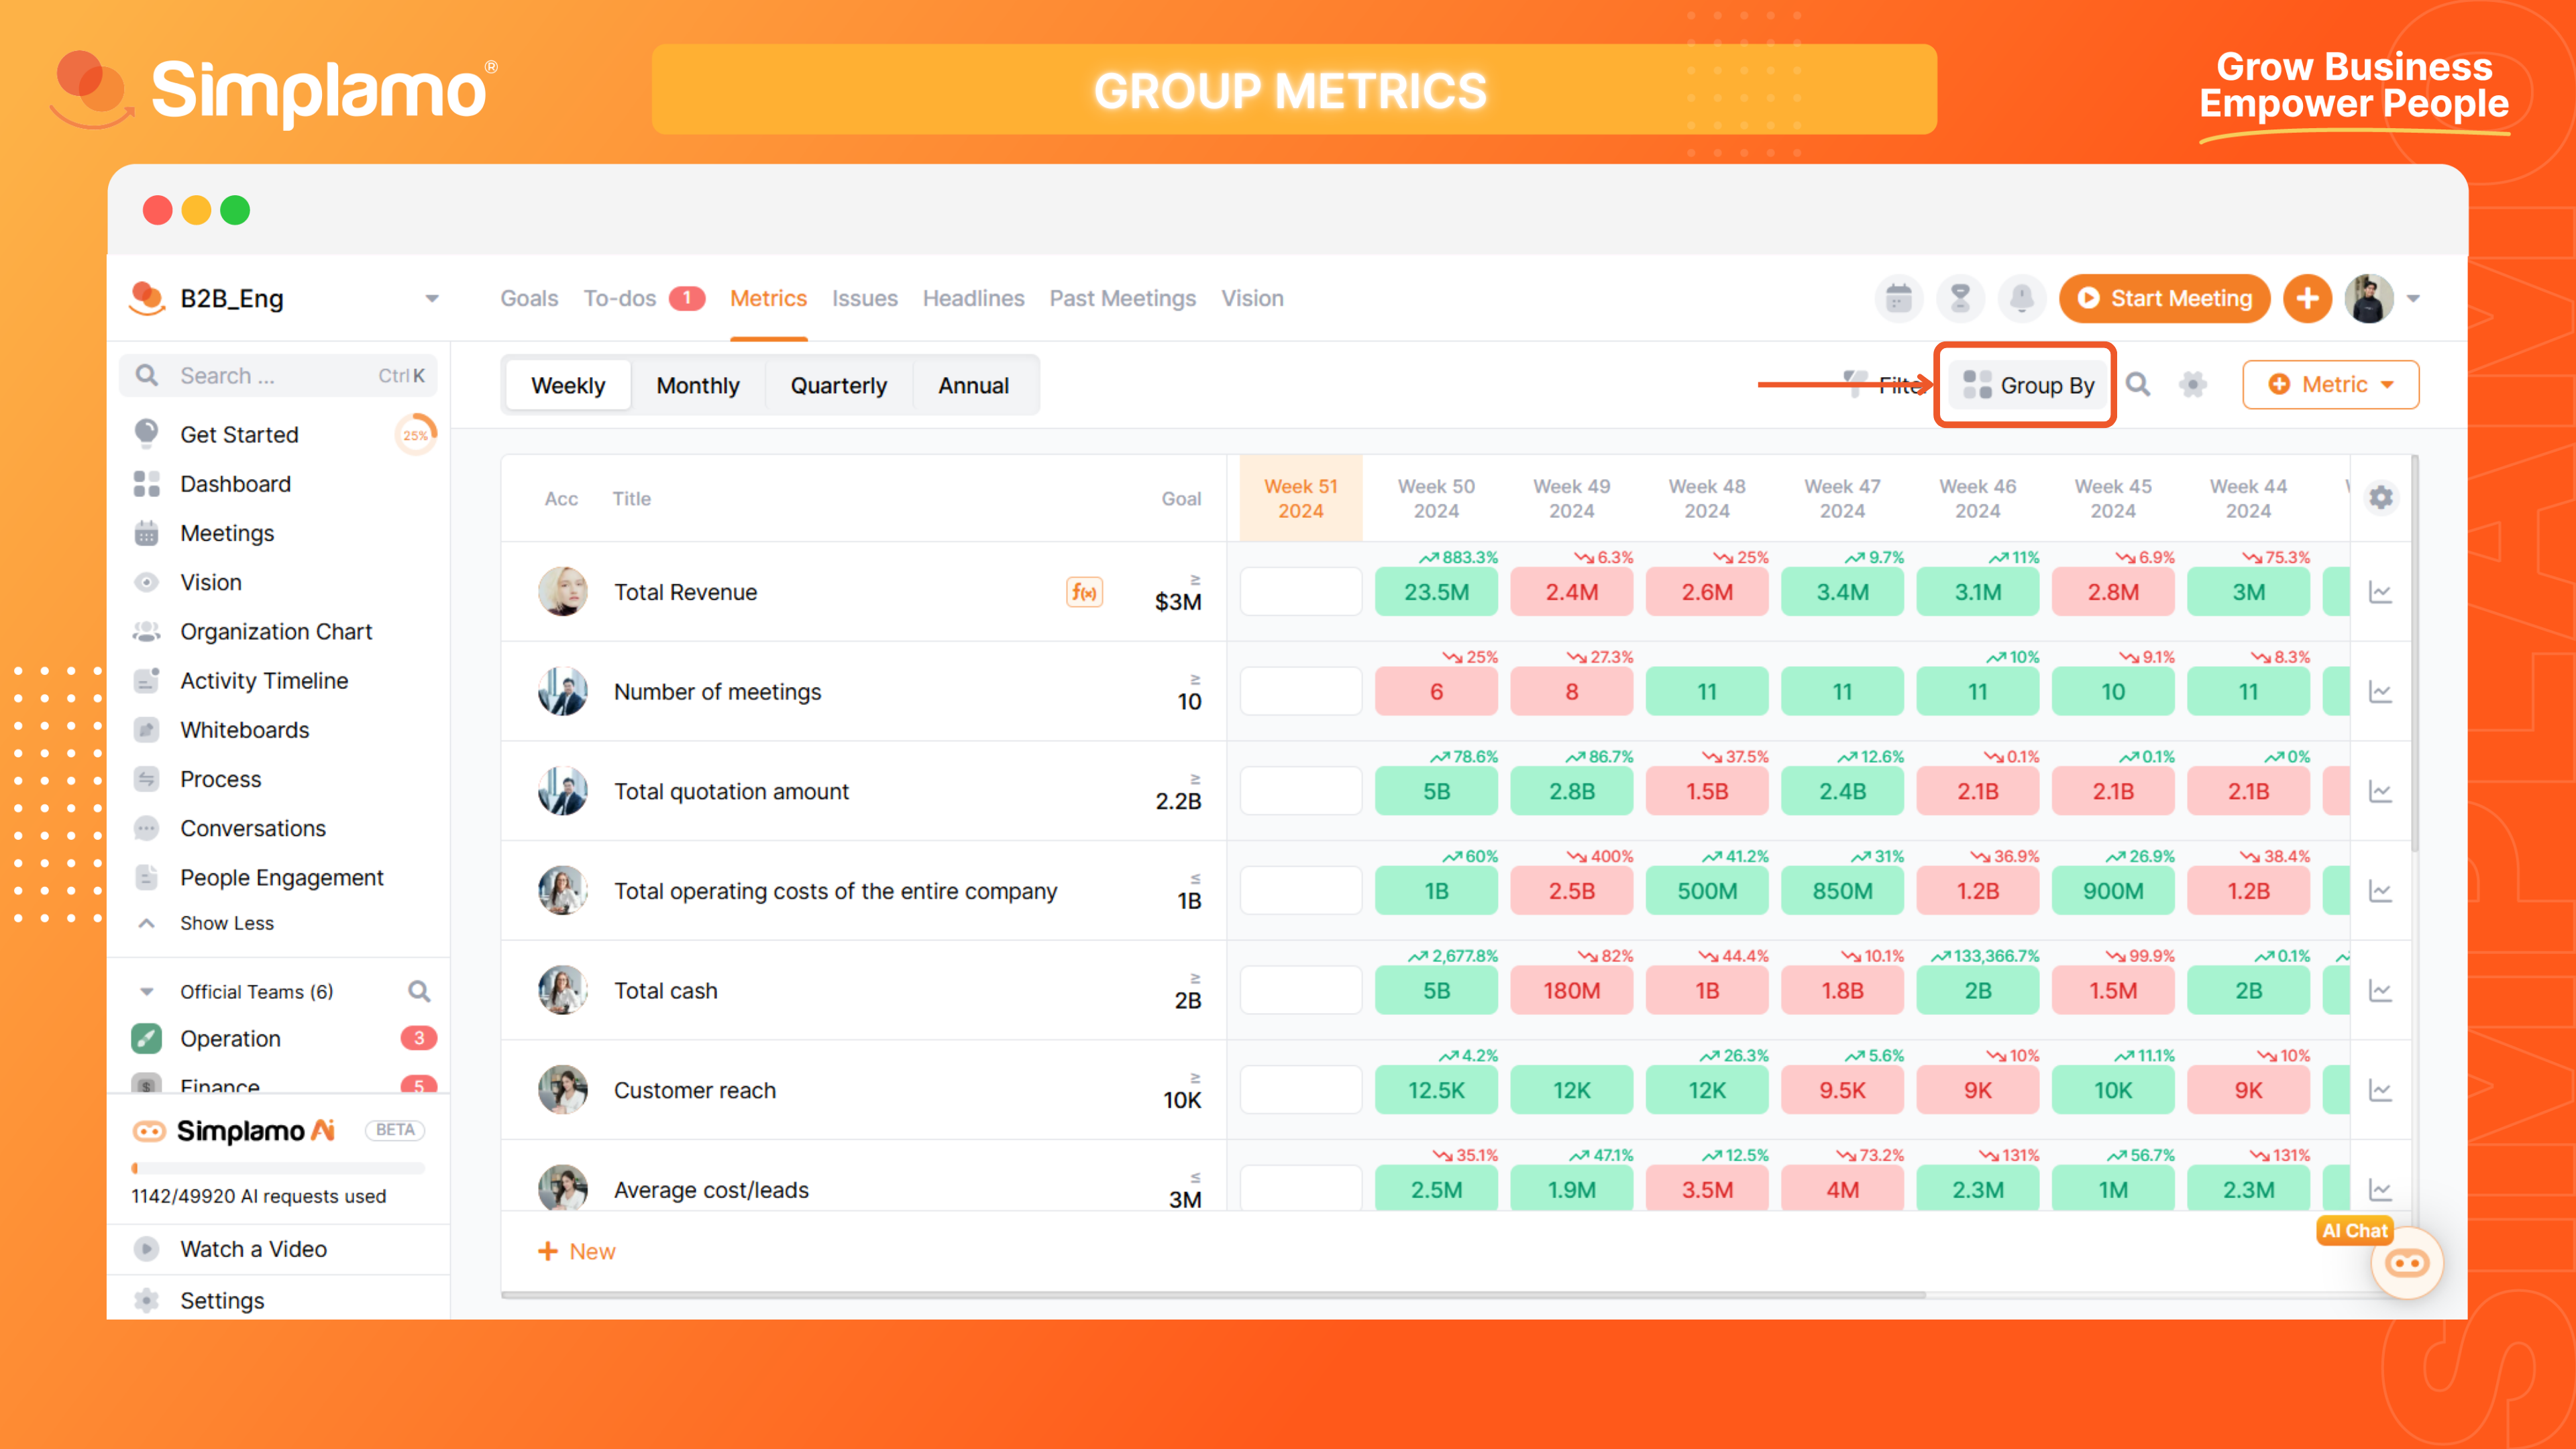
Step 1: On the "Metrics" page, locate the Search toolbar in the upper right corner and click on the "Group by" icon.
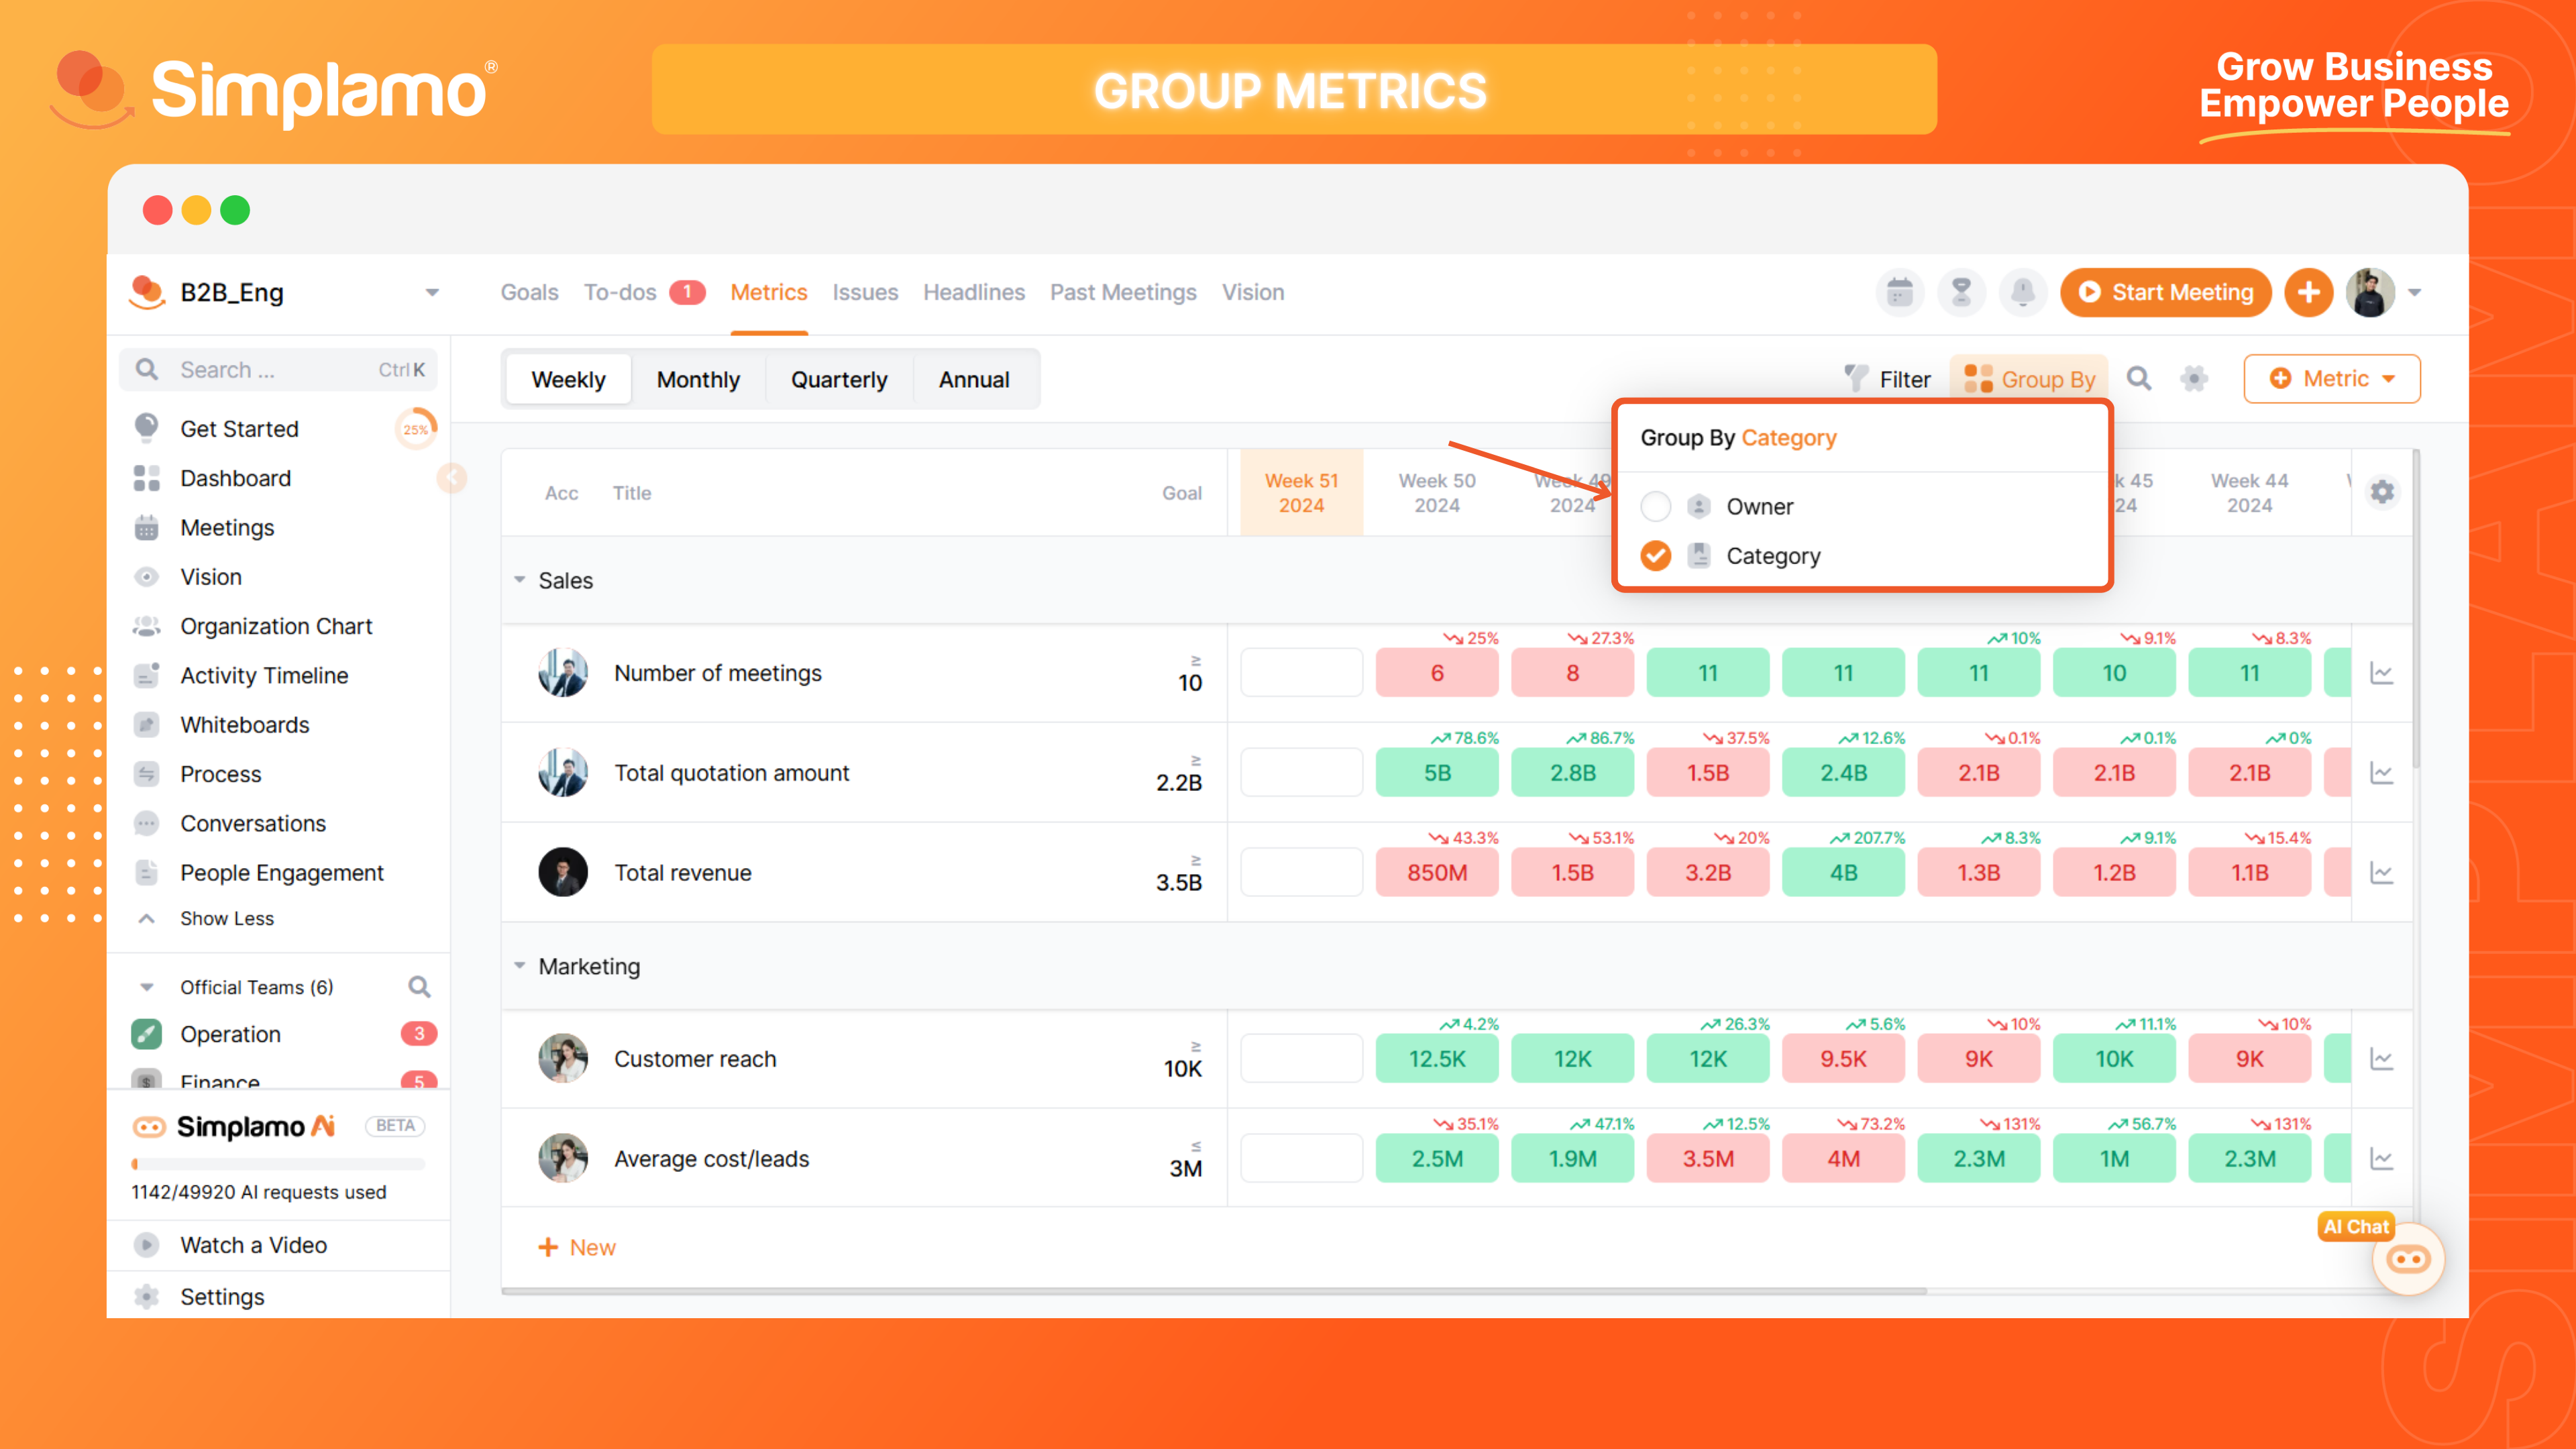
Step 2: Choose how to group your metrics. In the filter interface, you can group metrics in two ways:
Group by "Owner": The metric table will display metrics belonging to the same owner sequentially.
Group by "Category": The metric table will display metrics belonging to the same category sequentially.
Don't remember how to add or delete categories? See our detailed instructions HERE.
Filtering Metrics
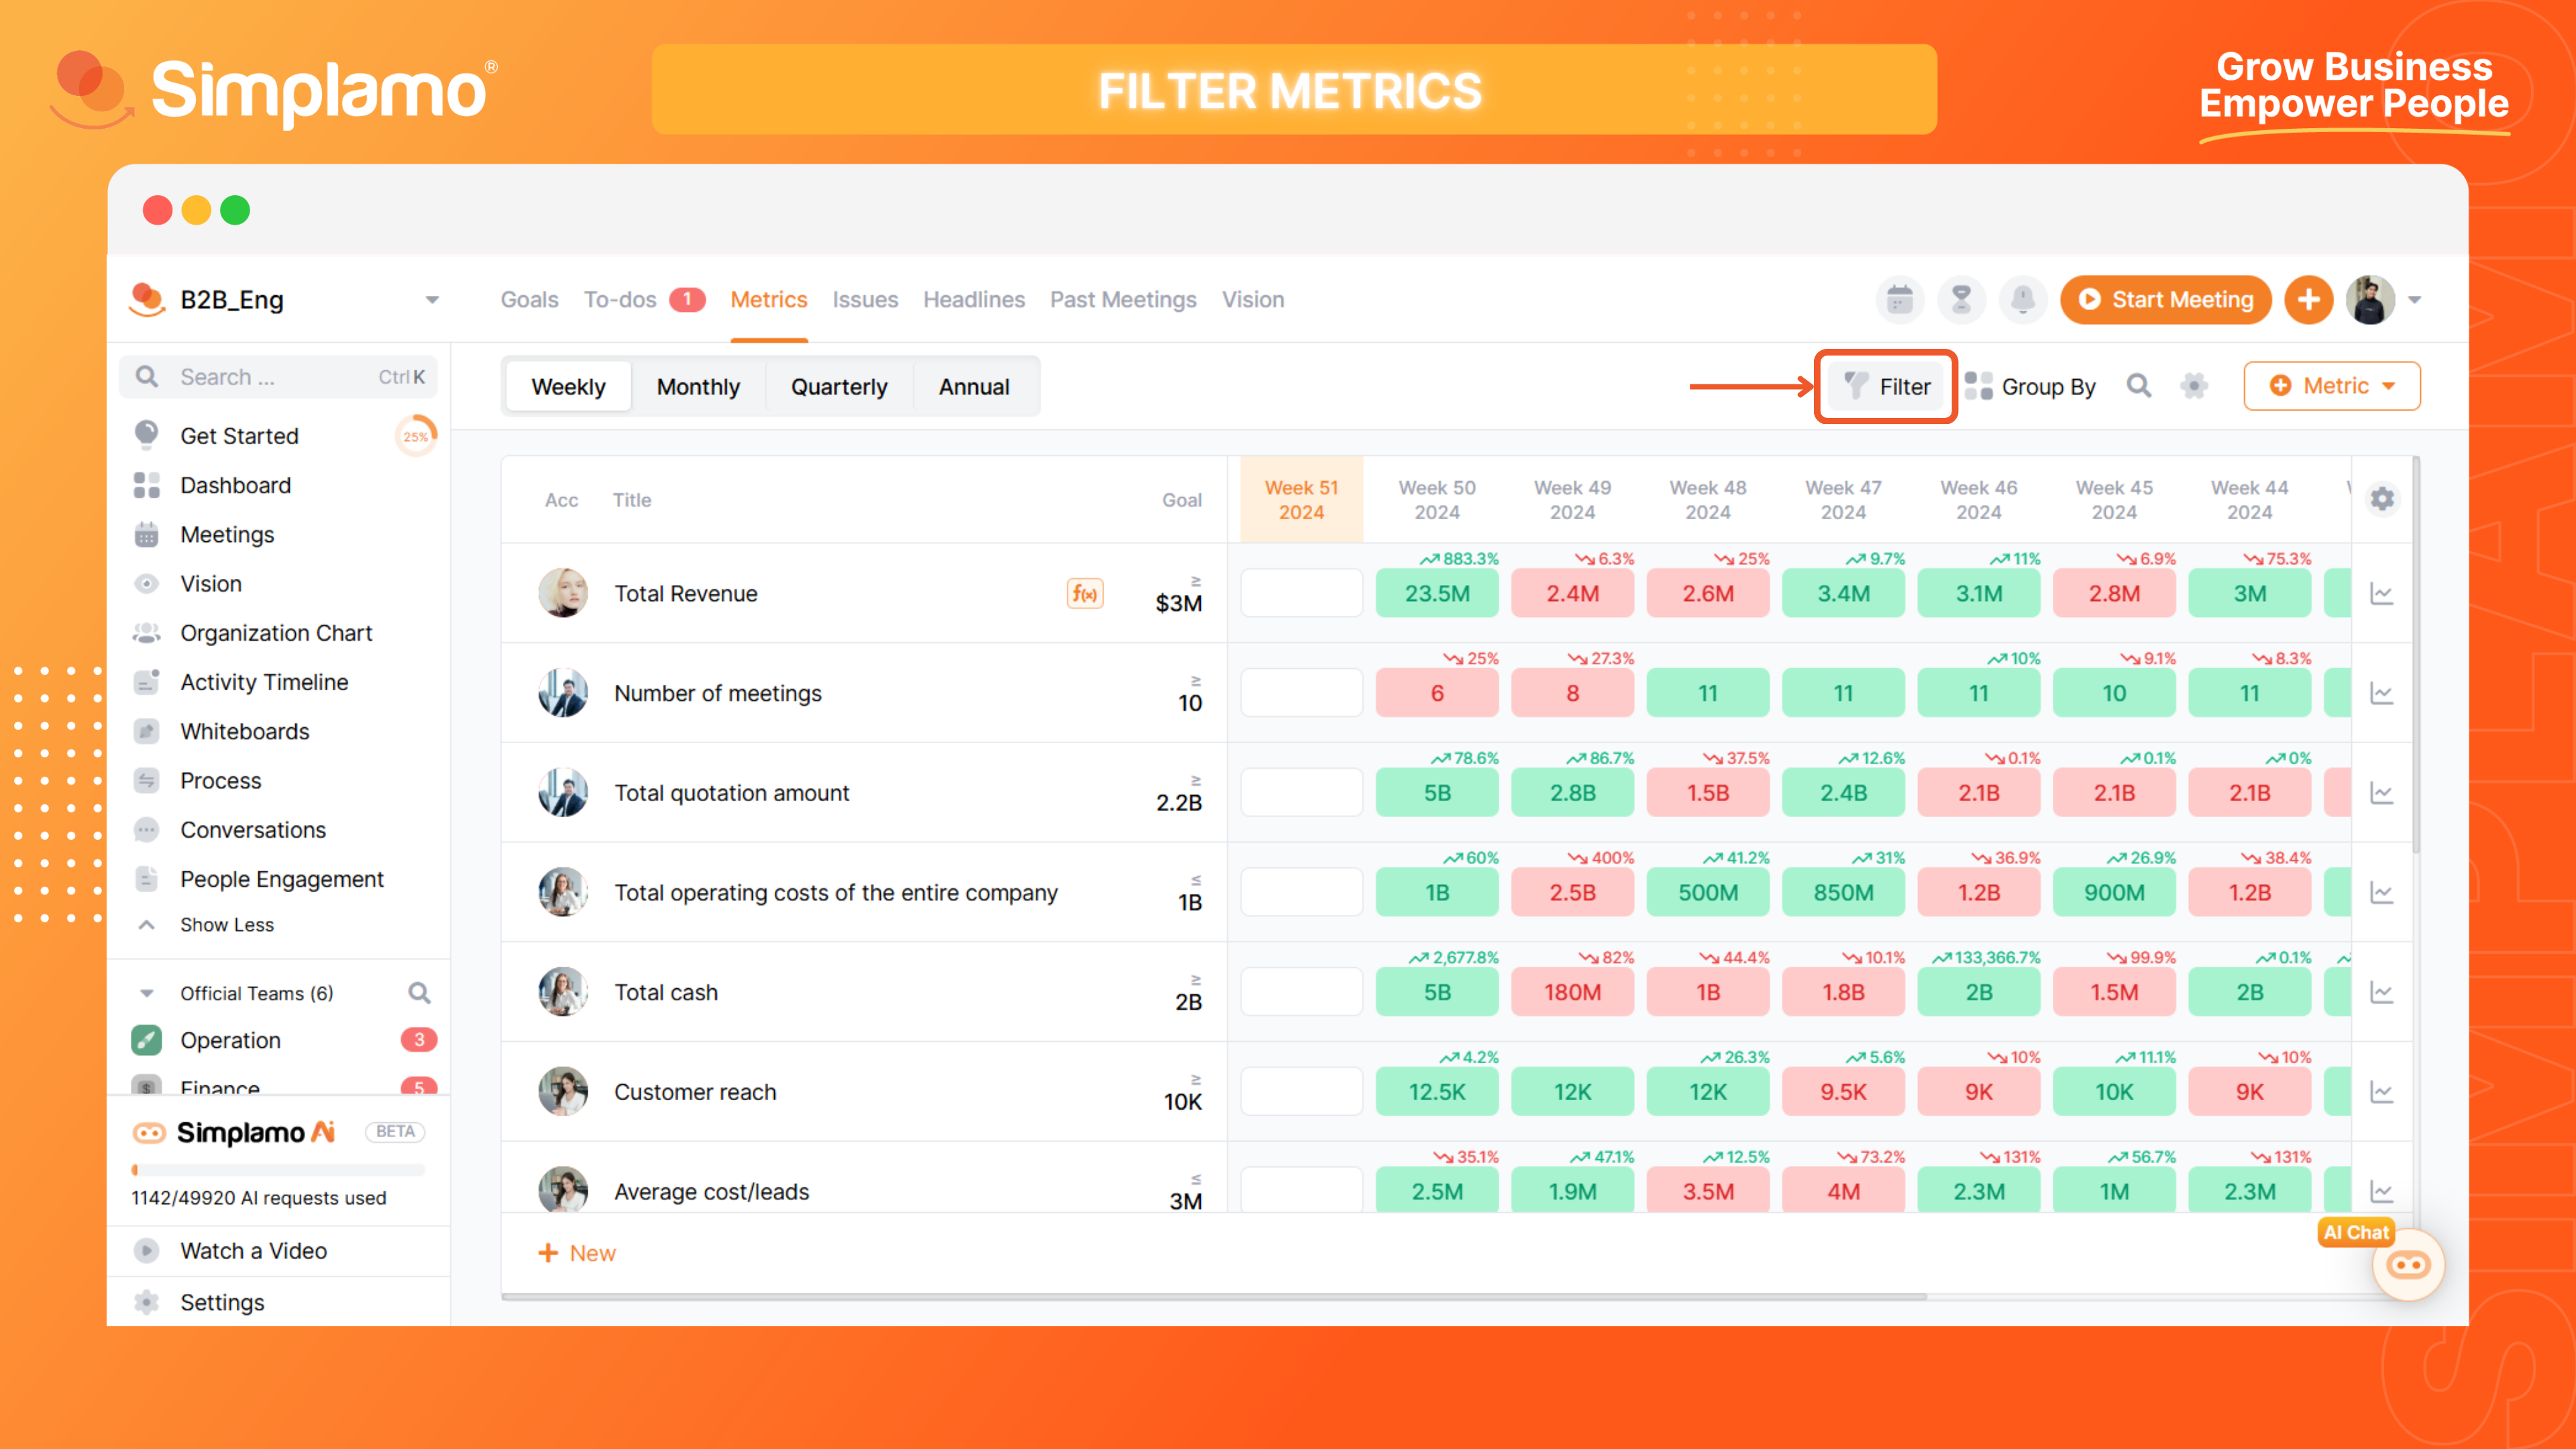
Step 1: On the "Metrics" page, locate the Search toolbar in the upper right corner and click on the Filter icon.
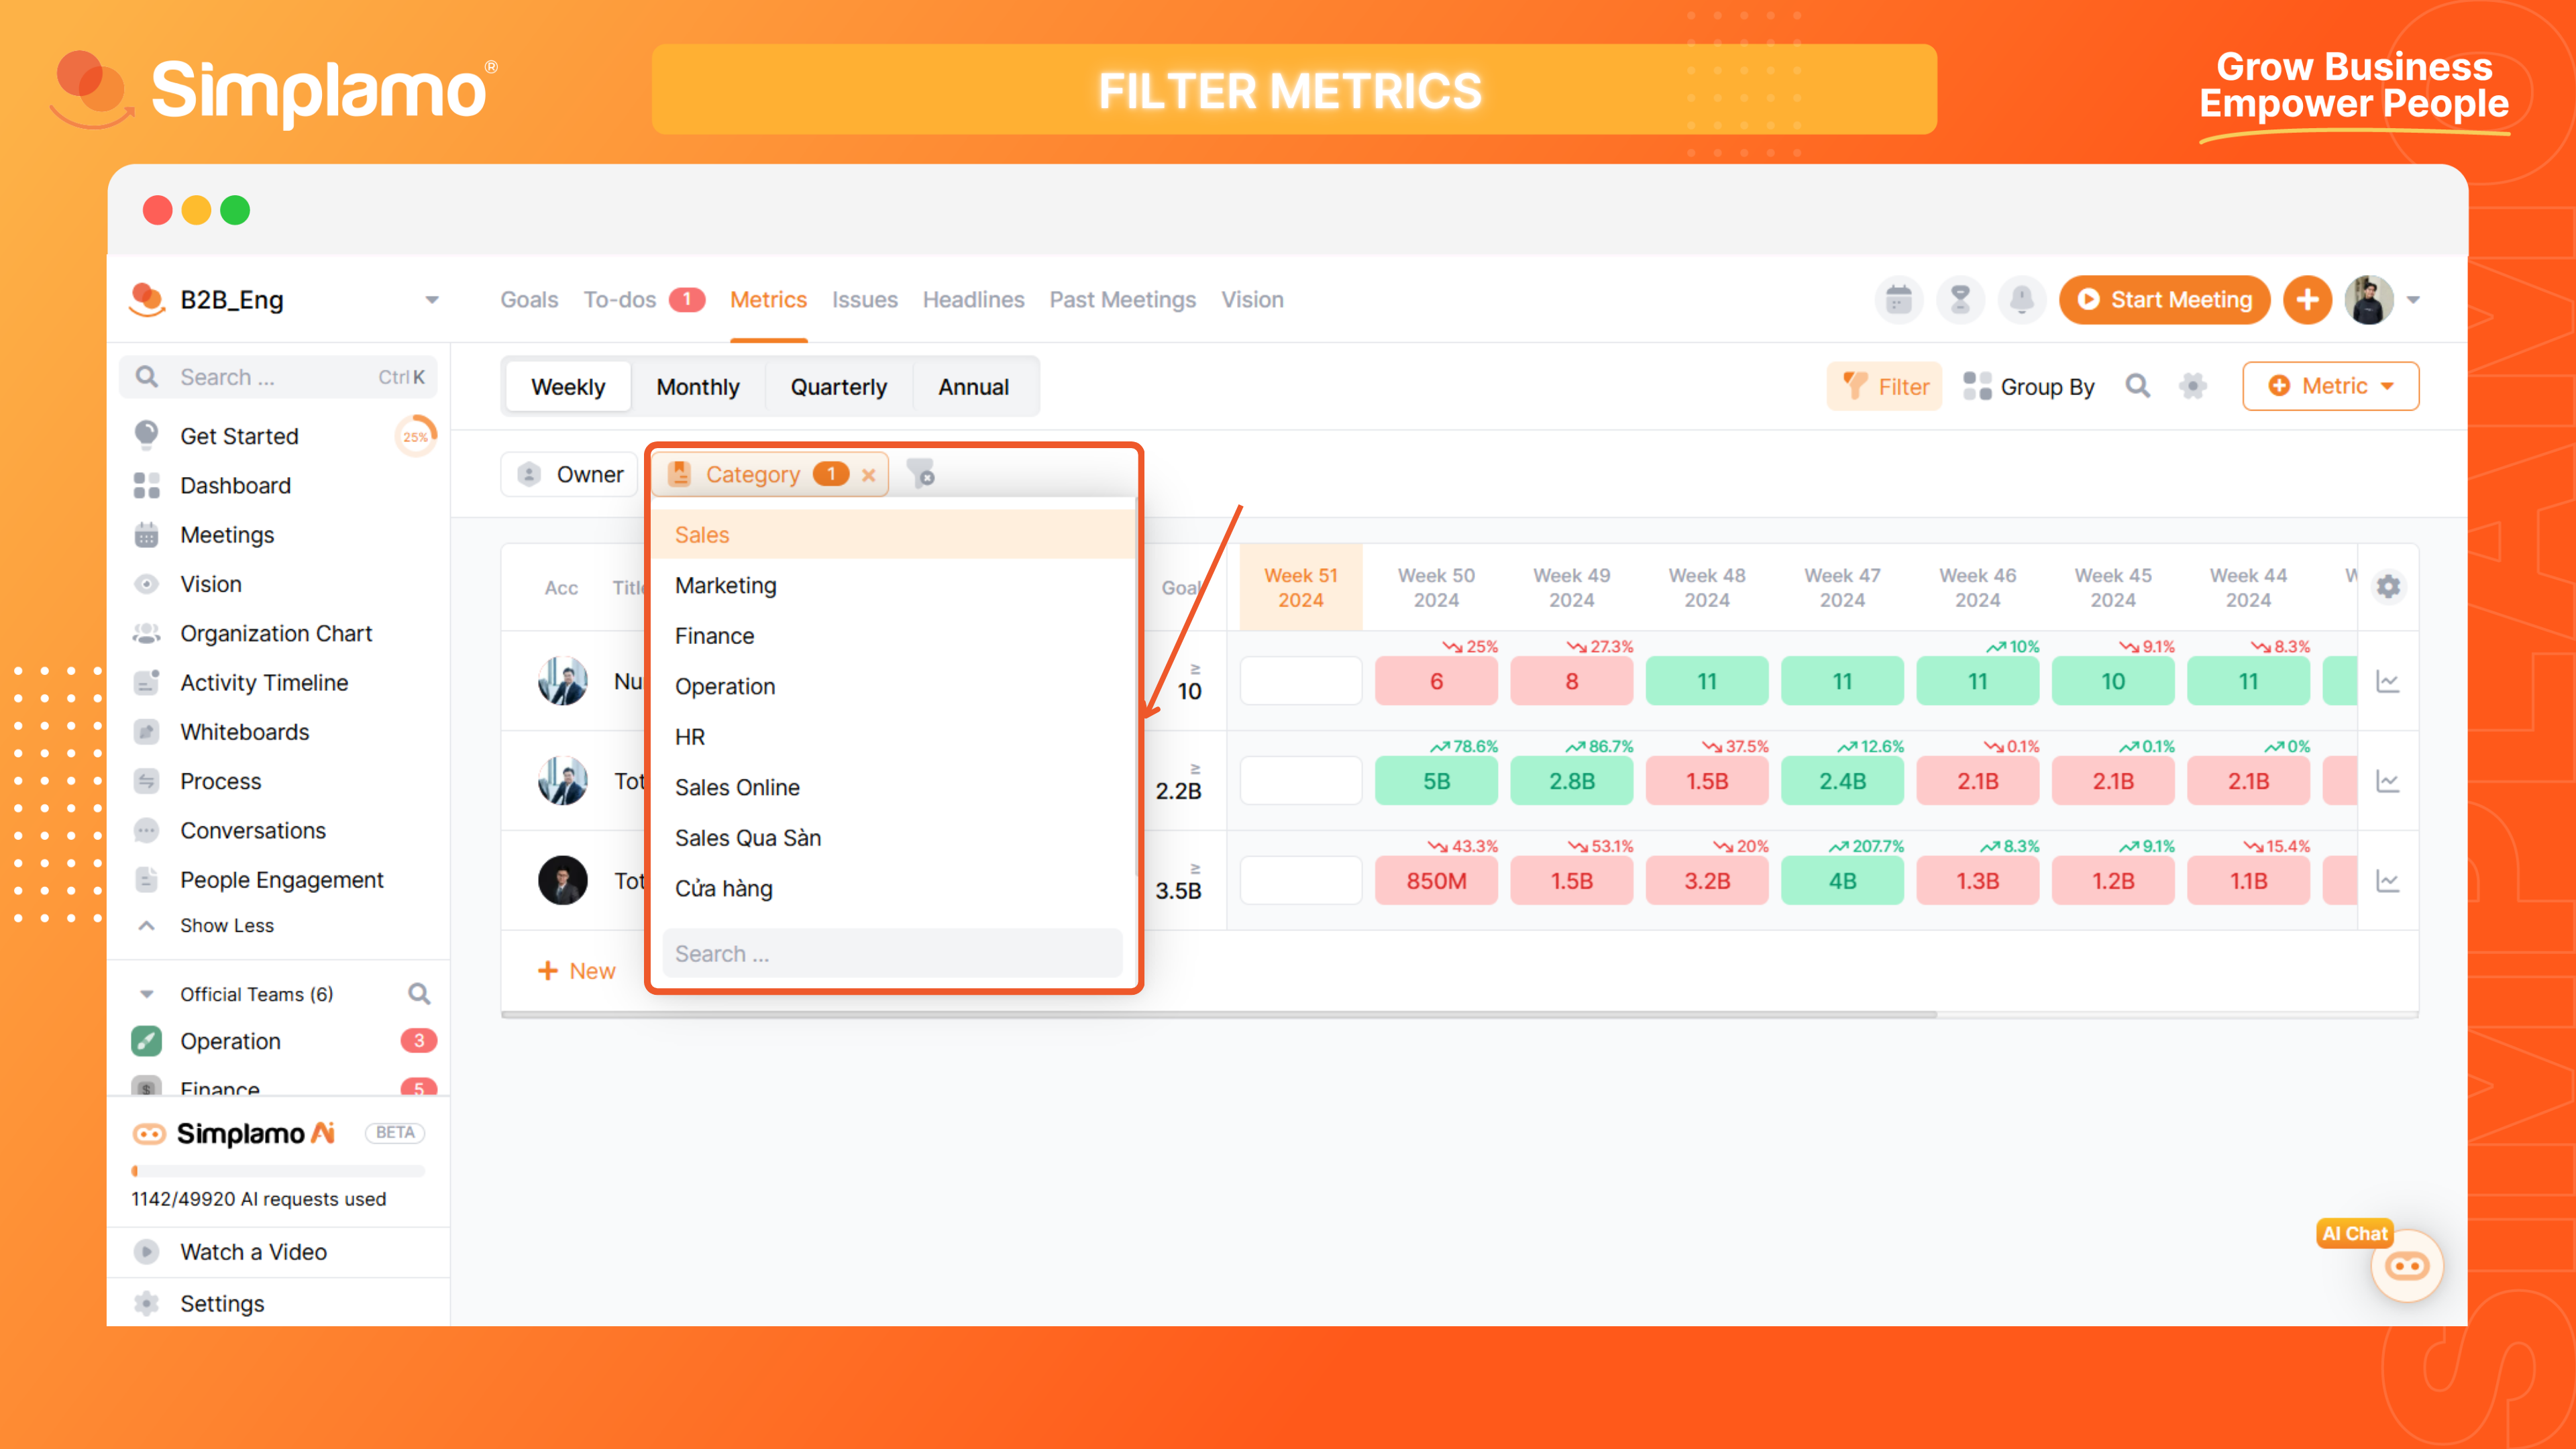
Step 2: Choose your filtering criteria:
- Filter metrics by "Category".
- Filter metrics by a specific "Time period".
Don't remember how to add or delete categories? See our detailed instructions
This is how to filter and group metrics. Let's work together to monitor our company's metric table and achieve our common goals most effectively.