Metrics Overview
I. Overview
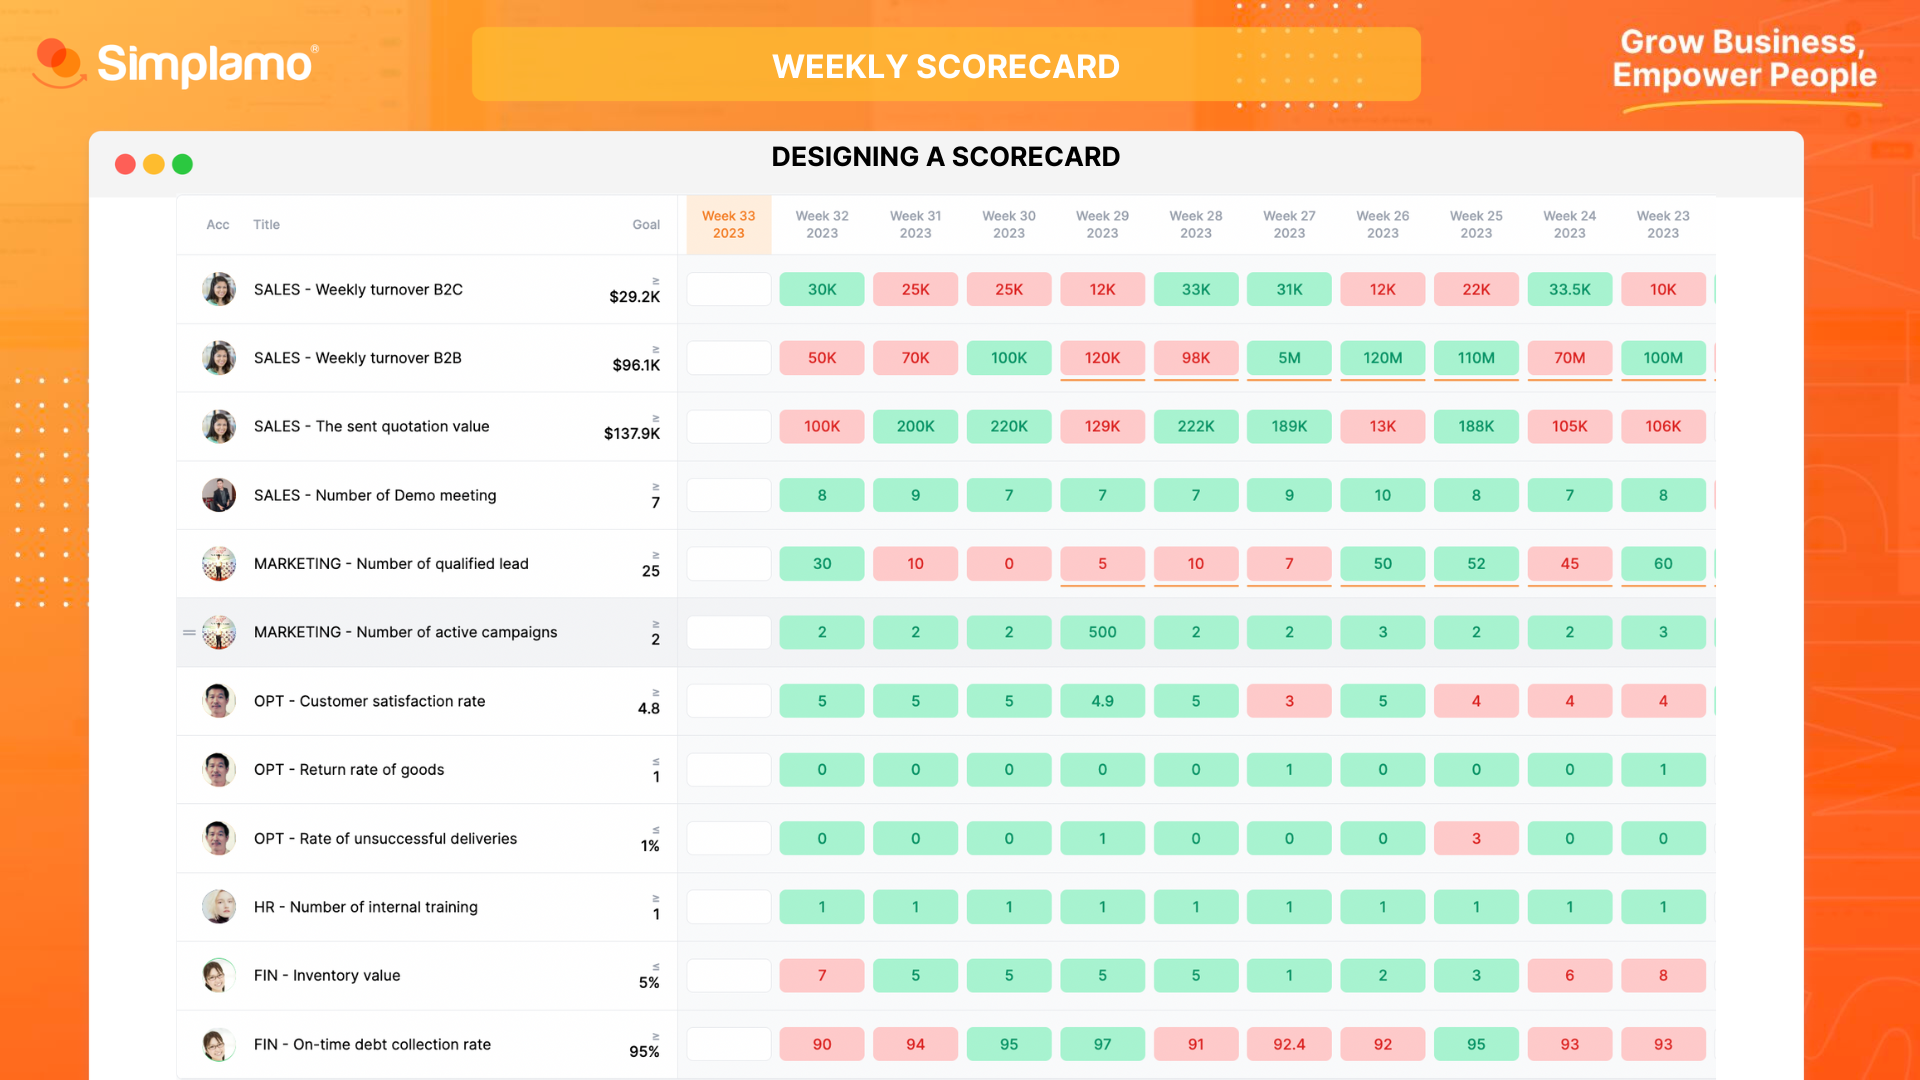
A scorecard contains a handful of numbers that tell you how your company or department is doing during the week, it will tell you what is working and what is not, from which lets you have a pulse and gives you the ability to predict issues.
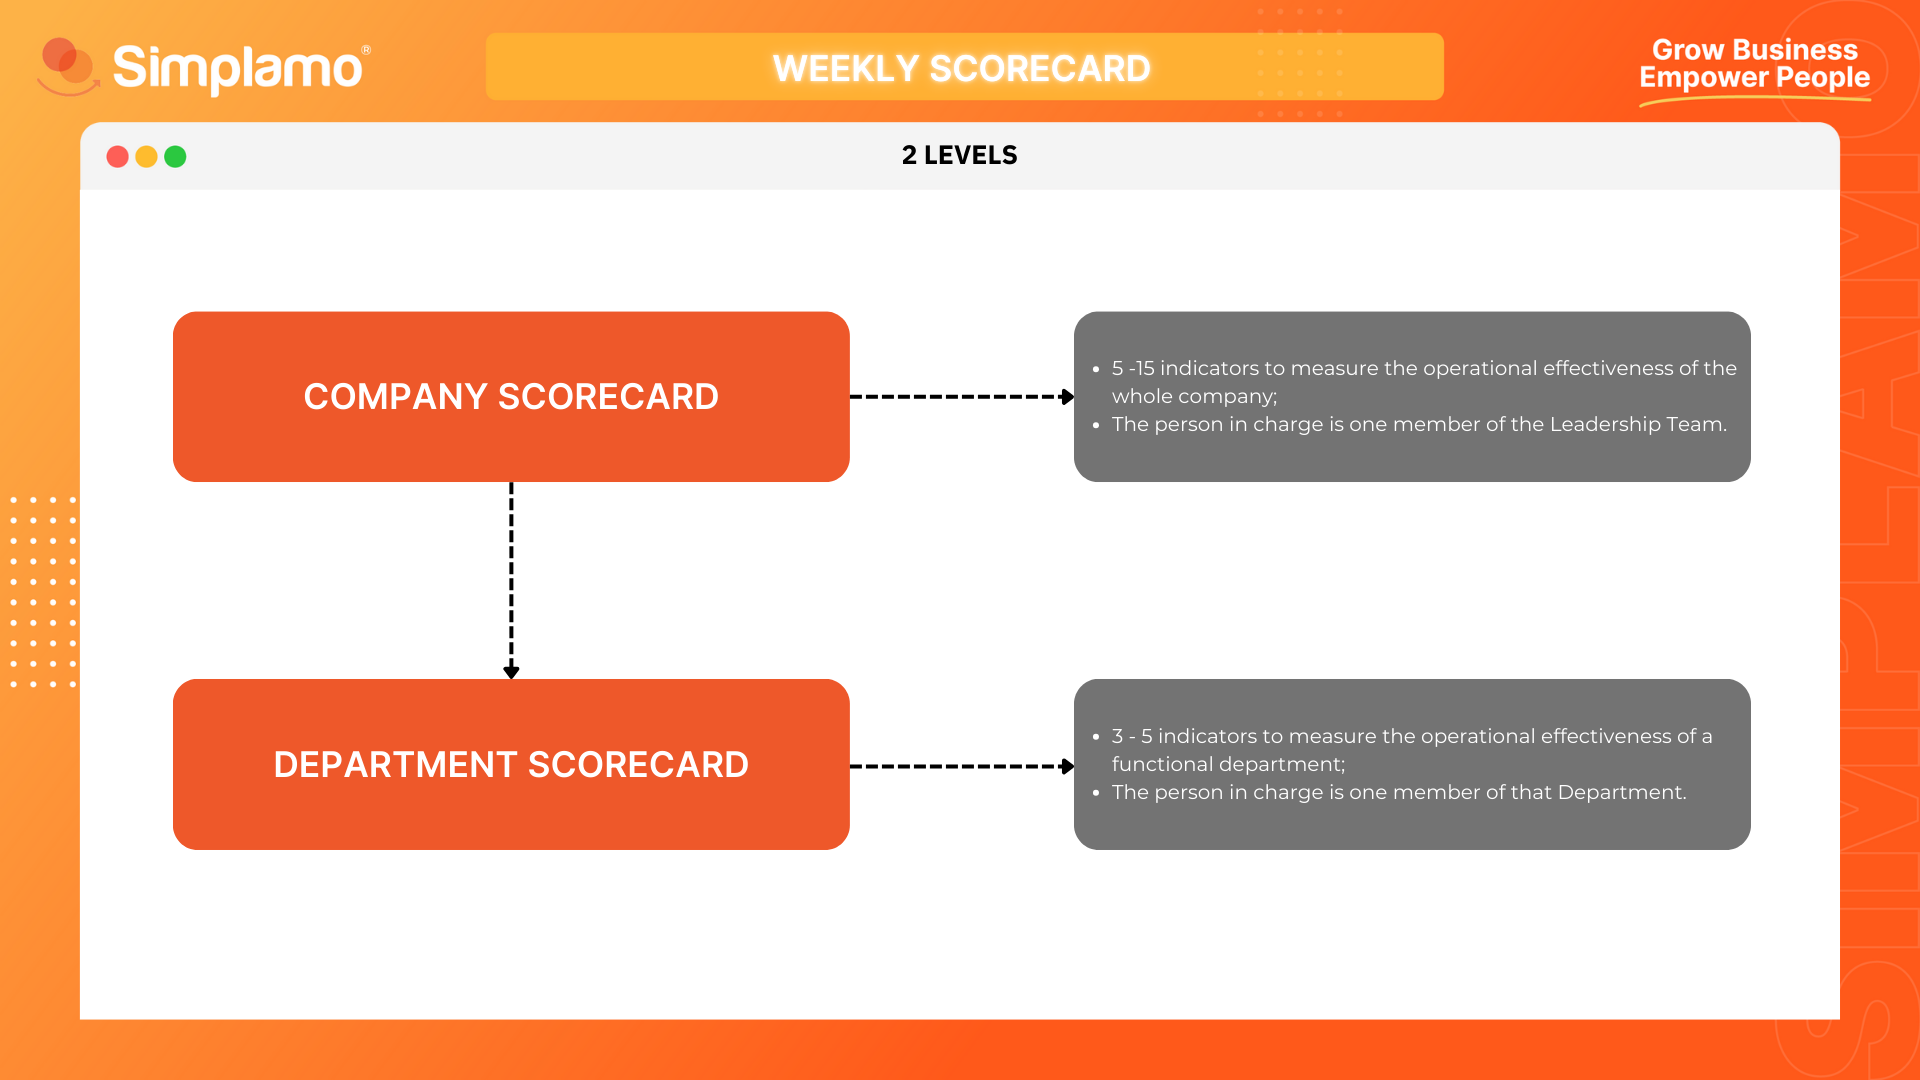
Metrics has two levels:
- Company scorecard: It typically has 5 to 15 numbers to measure the operational effectiveness of the whole company.
- Department scorecard: It usually has 3 to 5 numbers to measure the operational effectiveness of a functional department.
A scorecard whether company’s or department’s must have 5 elements:
- Title: The name of measurement you are tracking weekly
- Goals: The target that must be hit every week
- Owner: The person who’s accountable for the numbers
- Team Owner: The team that owns the number
- Finally, it is the actual weekly data for each measurable throughout a quarter (13 weeks)
You can read more about the How to setup Metrics table.
II. Structure
III. How-tos
Step 1: Select Team
Select the team that needs to create Scorecards, in case of creating Company Metrics – choose “Leadership team”.
To Continue, select "Metrics" feature on the horizontal toolbar.
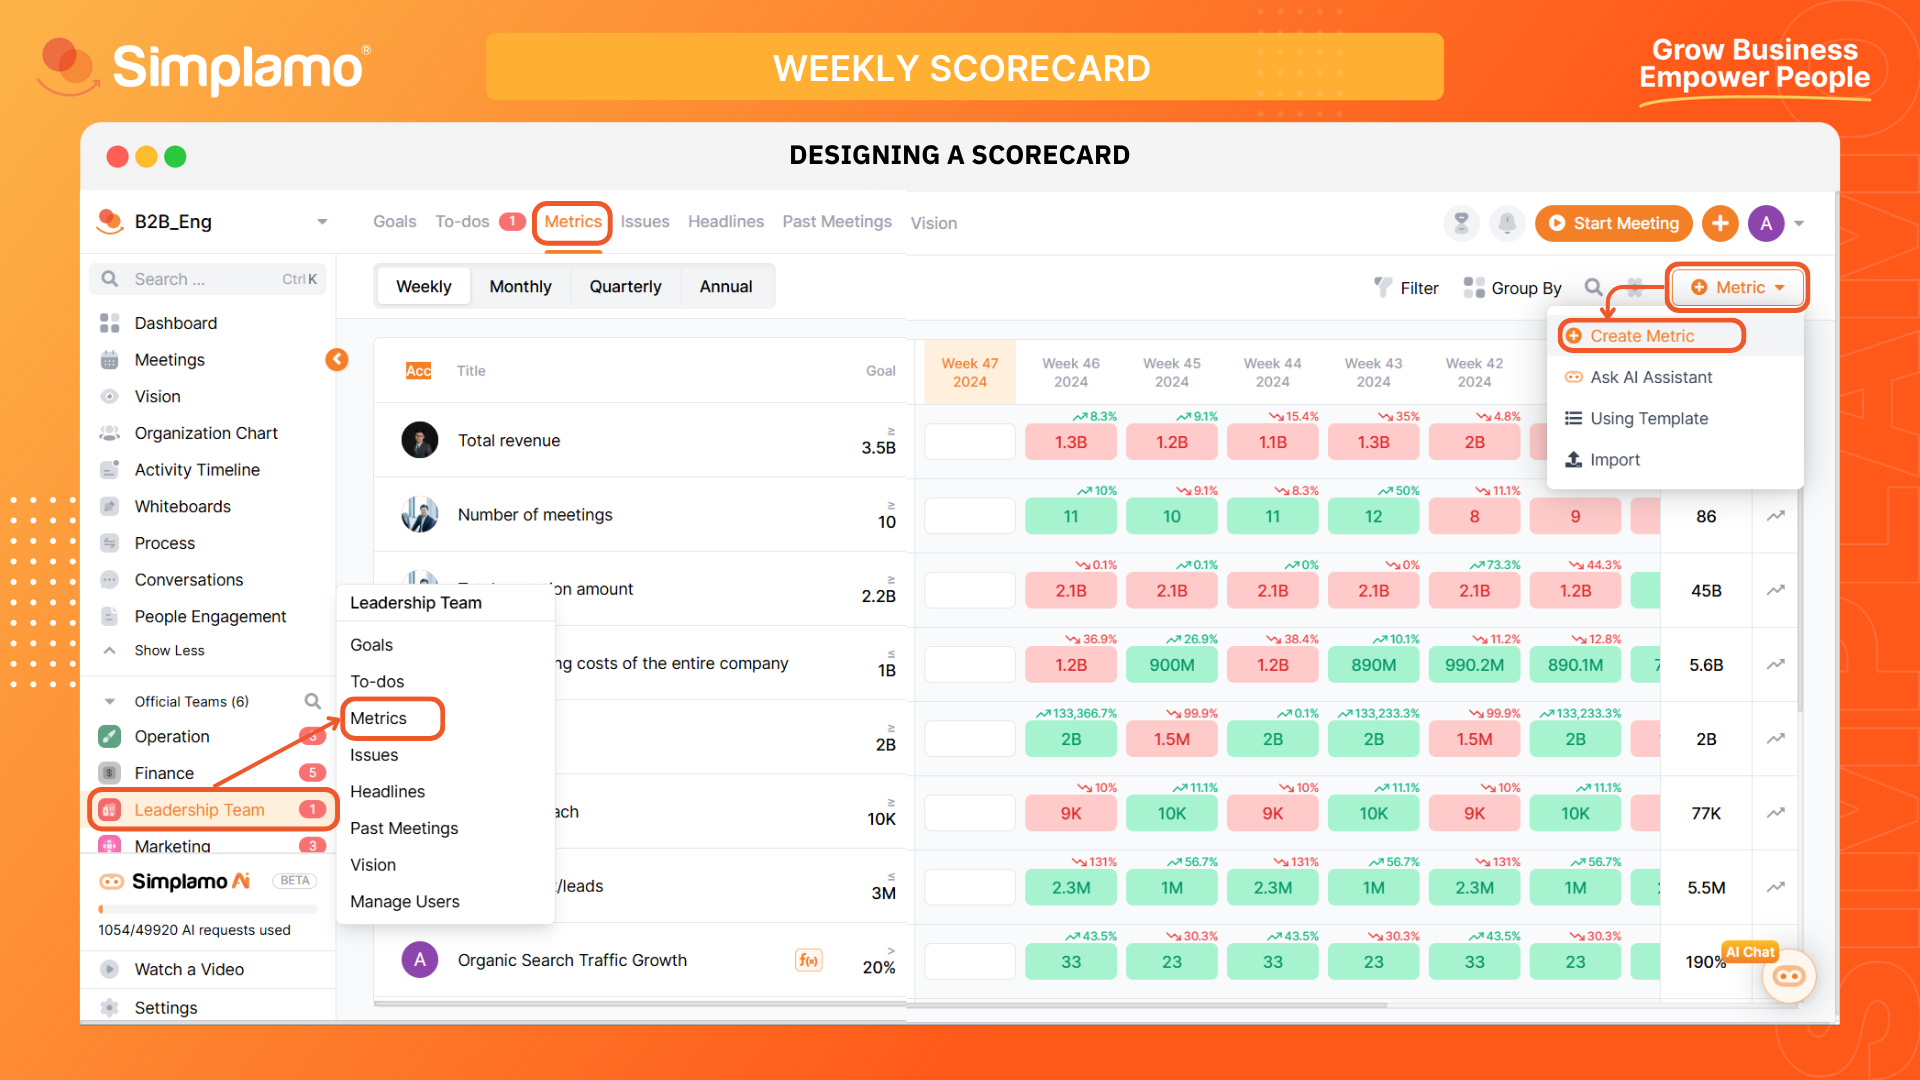
Step 2: Create Measurable(s)
Click “Create Metric” to create new ones.
- Input “Title”
- Select “Type” of the scorecard (usually measured weekly)
- Select the right “Unit”: Number / Percentage / Currency
Set targets for each metric and fill the “Goal”.
Select the “Owner” and “Team Owner”.
If this metric needs to be tracked by other groups, you can click on the “Share with Teams” button to choose teams that need to see your metric.
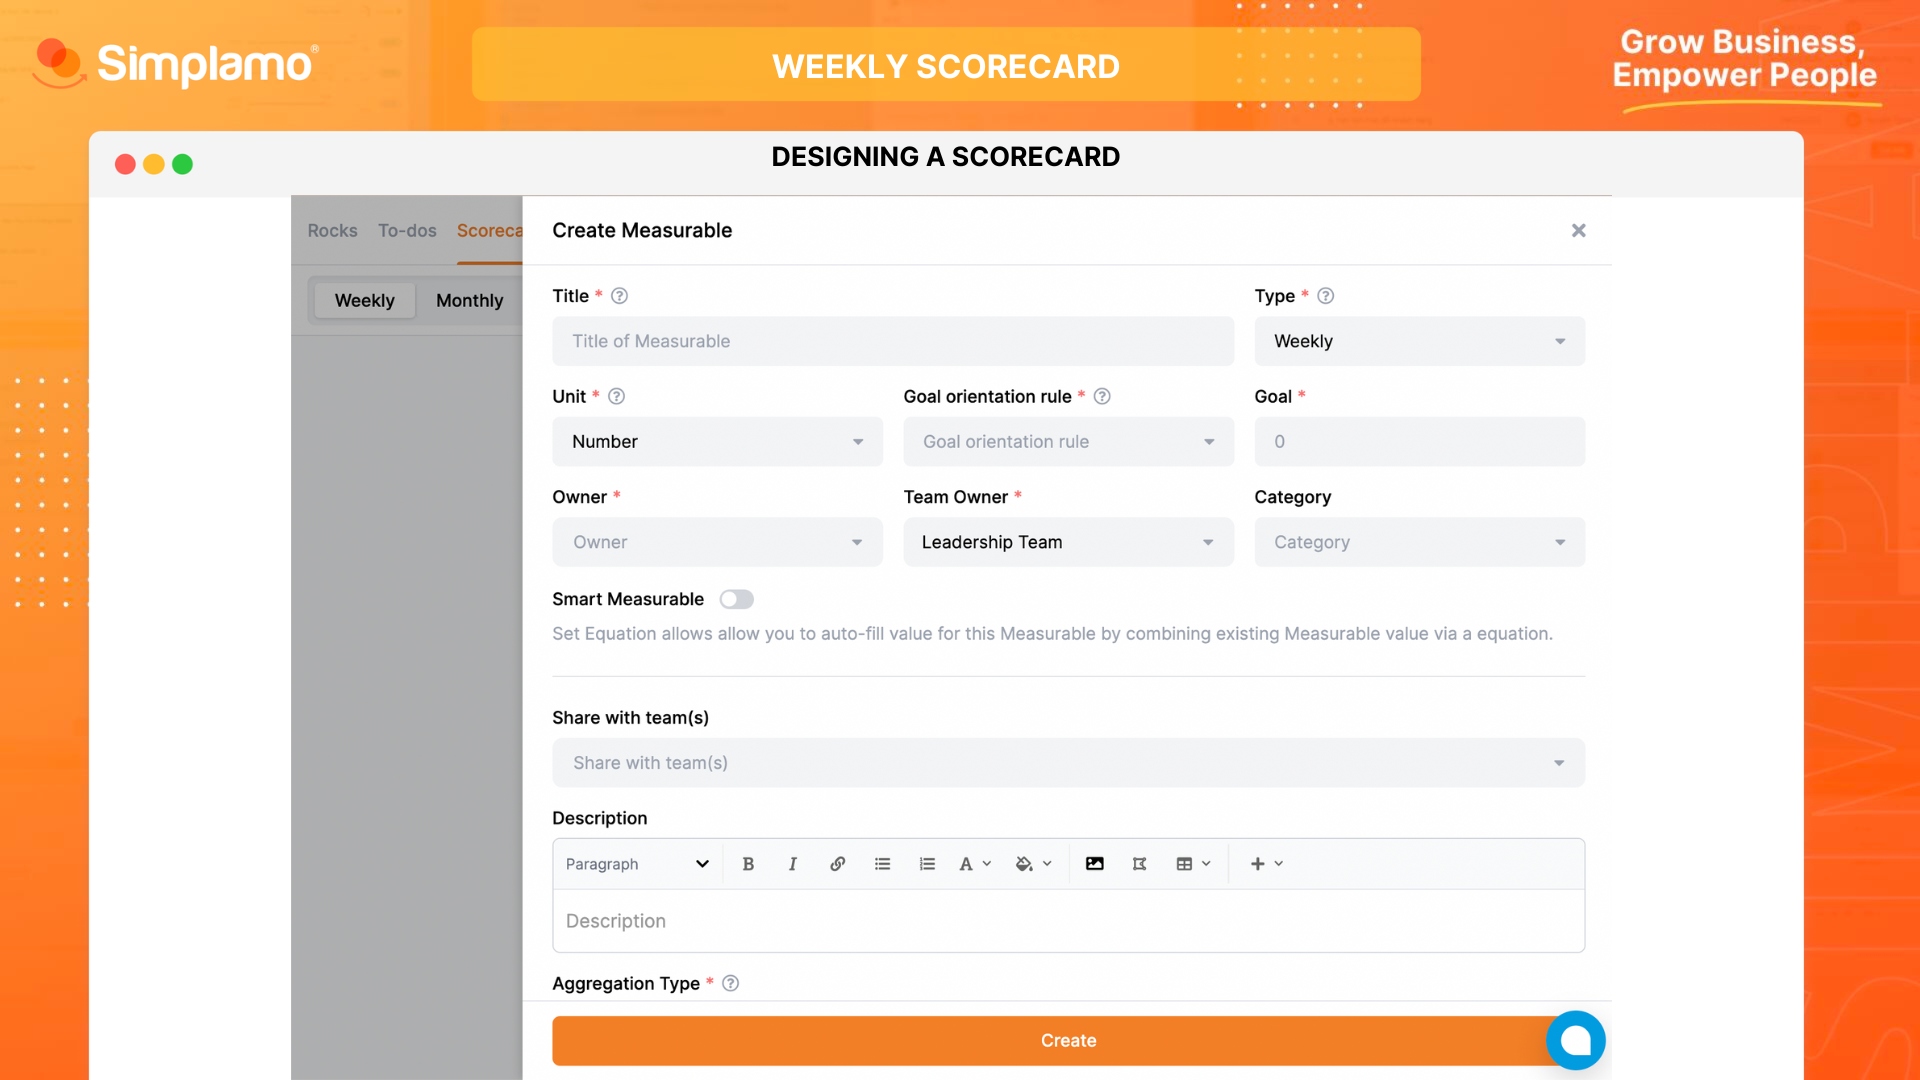
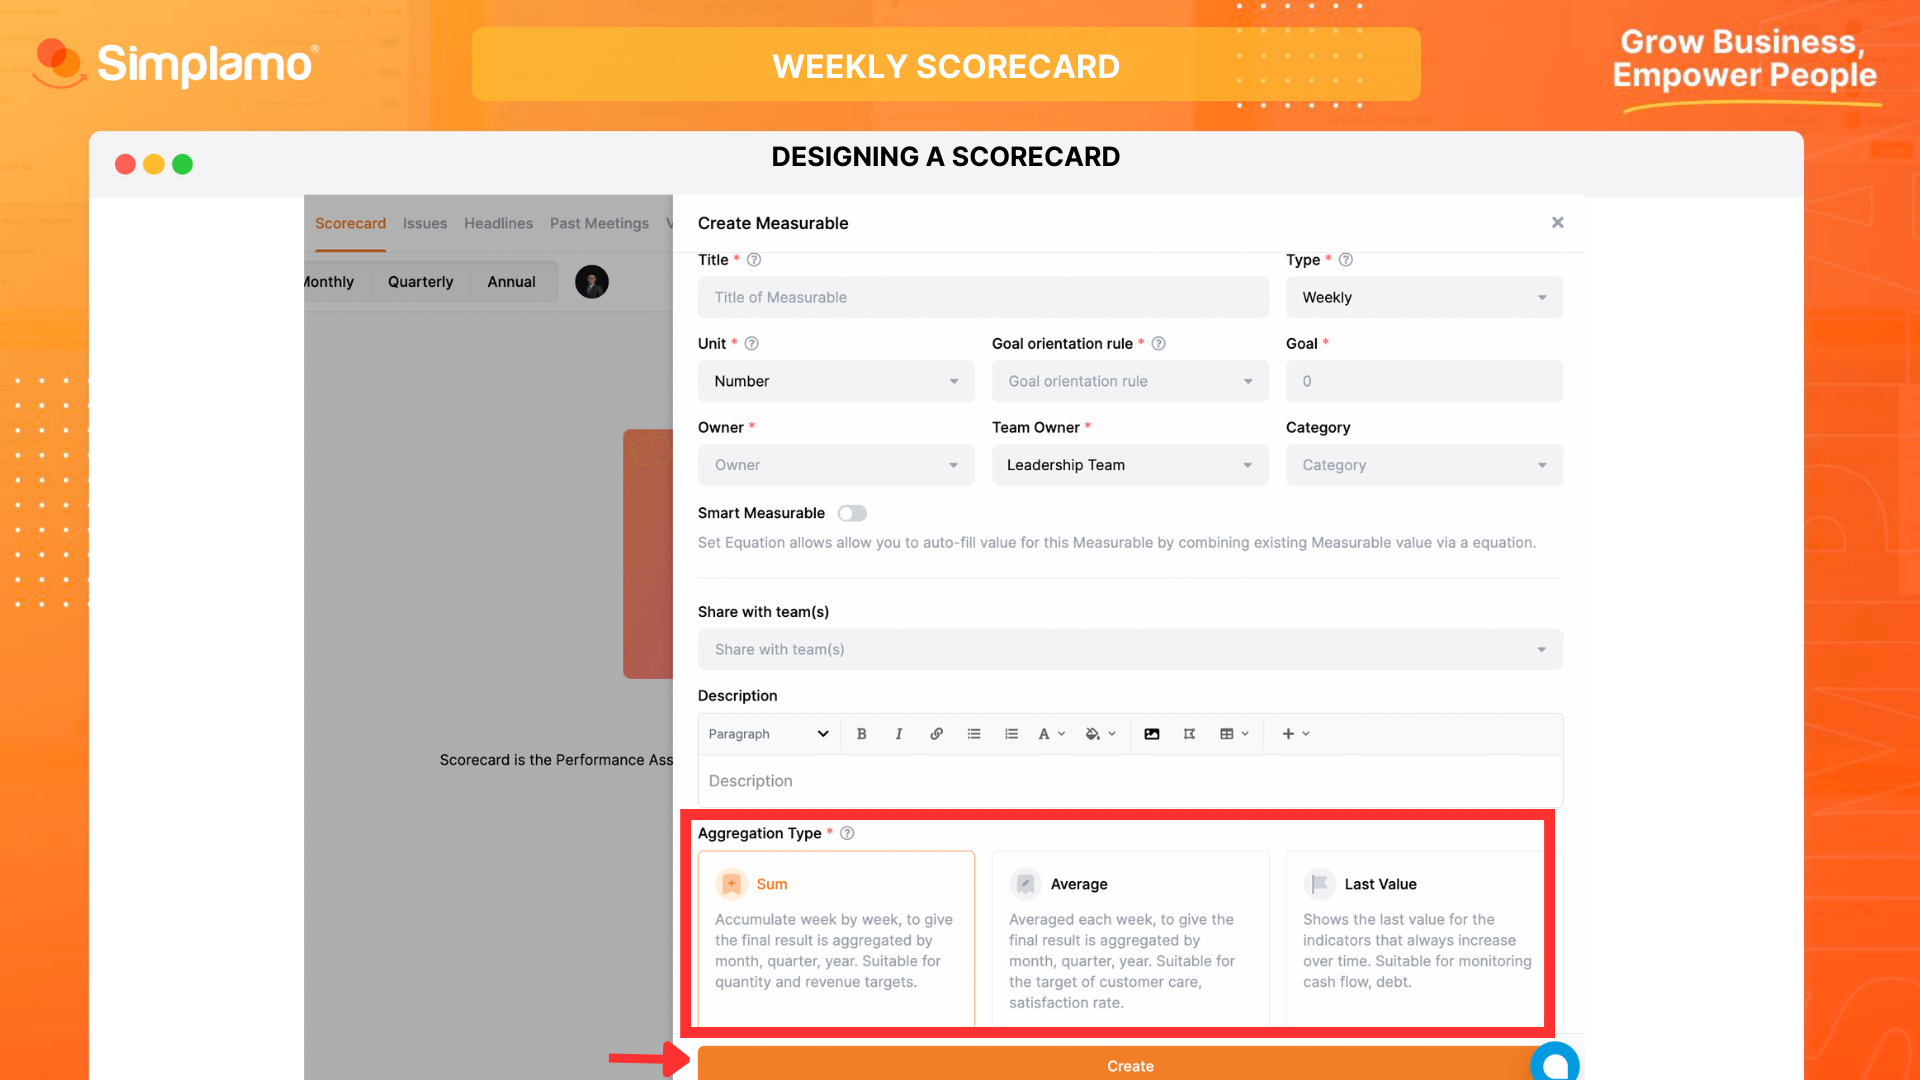
Step 3: Aggregation Type
Next, we need to select the aggregation type for Metrics. Choose the appropriate type based on the metric and needs.
There are three aggregation types available:
- Sum: Accumulate weekly, to give the result aggregated by month, quarter, and year. Suitable for targets related to quantity or revenue,…
- Average: Average weekly to give the result aggregated by month, quarter, and year. Suitable for targets related to rate, for example "Customer satisfaction rate" .
- Last Value: Shows the lastest value of the metric that always increases over time. Suitable for targets related to monitoring cash flow or debt.
- Finally, click "Create".
**Note: The key to success is to have only 5 to 15 metrics* in the Metrics to ensure that you are closely monitoring the most critical activities of the business.
By following the steps above, you will have successfully completed setting up an effective business Metrics on Simplamo.
Let's keep track of the actual weekly data on the Metrics by conducting your weekly meetings.