Weekly Metrics
I. Definition
You may have heard of terms such as Dashboard, Flash Report, Pulse Report, Business KPI,... - all of which are similar in concept. Simplamo chooses the concept of Metrics - a table consisting of 5 to 15 performance evaluation indicators of the business that the leadership team will review weekly through meetings.
It is simply a tool to evaluate your business health and the adherence to processes by employees, it will tell you what is working and what is not, from which lets you have a pulse and gives you the ability to predict.
Metrics always has specific numbers to measure and every employee in the company must have at least one indicator.
Let's explore about Metrics right away.
II. The Importance
Numbers speak for themselves and eliminate assumptions, subjective opinions, emotions, and personal egos in daily conversations, turning your business into a scoreboard where you can see the health of your business or department.
It will show you what is efficient, inefficient, help you identify and solve problems before they become disasters.
Everyone in the Company should have at least 1 Measurable or number for which they are accountable. Why?
- NUMBERS ELIMINATE VAGUE INTERACTIONS BETWEEN MANAGEMENT AND EMPLOYEES: For example, the sales manager's feedback to the sales team regarding last week's activities was very vague based on the salesperson's answer "I had 3 customer meetings." If the company's target is 3, that's great, but if the company needs 10, then we have a problem to solve.
- NUMBERS CREATE ACCOUNTABILITY: When everyone owns a number, we will know what to do. Accountability begins to be clearly demonstrated, and there is nothing clearer than numbers.
- RESPONSIBLE PERSONNEL ALWAYS VALUE NUMBERS: "Wrong people" sitting in the "Wrong seat" always resist specific measurements. Conversely, "Right people" - "Right seat" always love clear numbers that they need to achieve, they are interested in being part of an organization where everyone has high responsibility.
- NUMBERS CREATE CLARITY AND COMMITMENT: When everyone is clear and in agreement, they can achieve it, creating commitment to the company and department.
- NUMBERS CREATE COMPETITION: Any business can set up a target indicator table to share with everyone to create fair competition and transparency. It can create uncomfortable experiences, but there's nothing wrong with a bit of pressure in business.
- NUMBERS CREATE RESULTS: Simply put, what can be seen clearly - will be improved.
- NUMBERS CREATE TEAM ACTIVITIES: When a team includes only people who are "Right people-Right seat," agree on the indicators to achieve, they will ask each other "How do we achieve it?" - which plays the role of a camera and equal pressures. Anyone who can't keep up with the team will be named.
- NUMBERS SOLVE PROBLEMS FASTER: When a number-based activity is "not achieved," you can recognize it - attack it - proactively solve the problem.
Owning a number also allows you and everyone to see each other's work clearly. Your number will support you in clarifying how to move forward towards your long-term mission in the company.
III. Designing Metrics
1. Company Level
- Company Metrics is a table consisting of 5 to 15 indicators that the leadership team will review weekly to measure the effectiveness of the entire business operation.
2. Department Level
- Departmental Metrics is a table consisting of 3 to 5 indicators (department level) that must be reviewed weekly to measure the effectiveness of functional departments.
3. Key contents
Regardless of the level, each scorecard must include the following information:
- Metrics Name
- Target Achievements
- Metrics Owner
- Actual Weekly Data for 13 consecutive weeks in a quarter.
IV. 2 Types of Indicators
1. Lagging Indicators
These indicators quantify the performance of roles on the Organization Chart.
Example:
One of role for Sales function is "Hit target sales number"
We can quantify this responsibility as "Signing 1 new contract of 10 million USD per month."
One of role for Marketing function is is "Bringing 10 potential leads per week"
We can quantify responsibility as "Acquiring 10 potential customers per week for Sales."
2. Leading Indicators
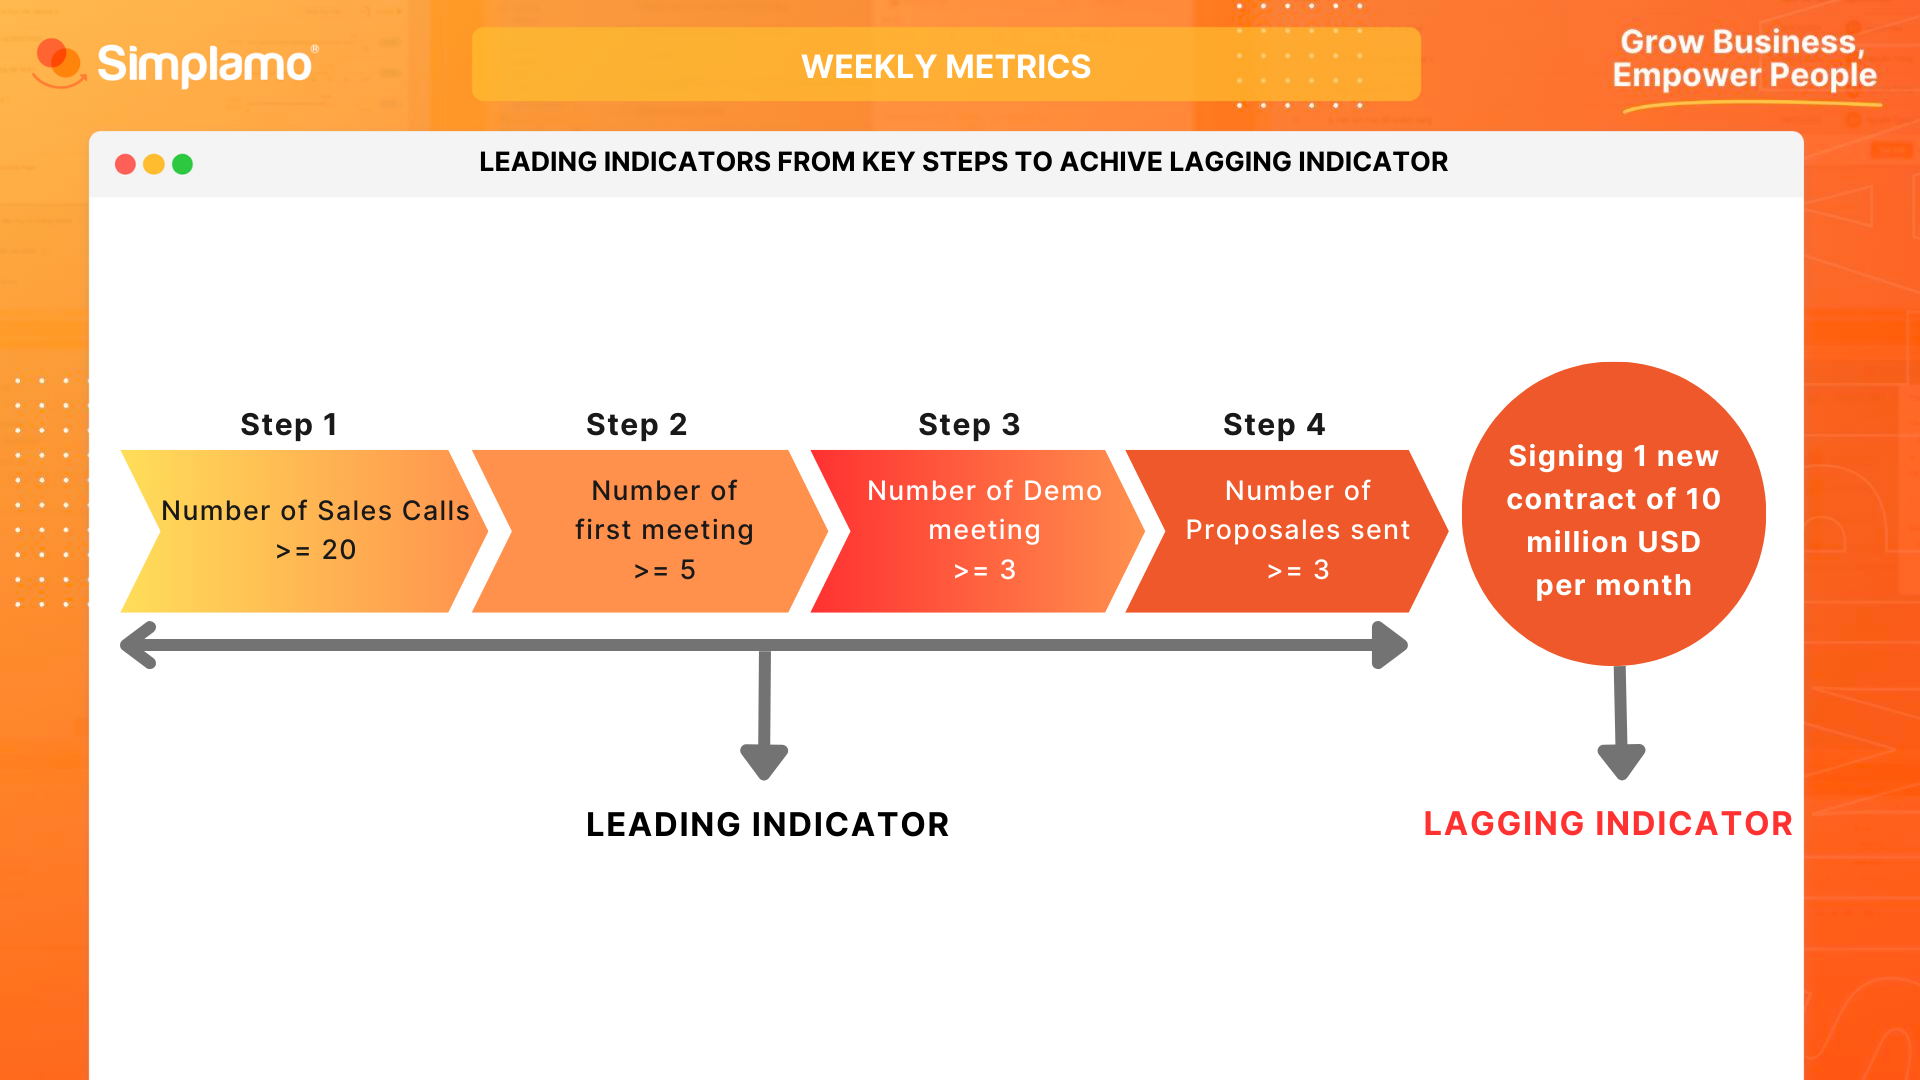
Leading indicators are selected from key steps in the process to achieve the lagging indicators.
Simply put, leading indicators are the "actions" that drive the results.
Example:
Continuing from the previous examples, we can list the following leading indicators to measure weekly according to work process:
Leading Indicators to achieve "Signing 1 new contract of 10 million USD per month"
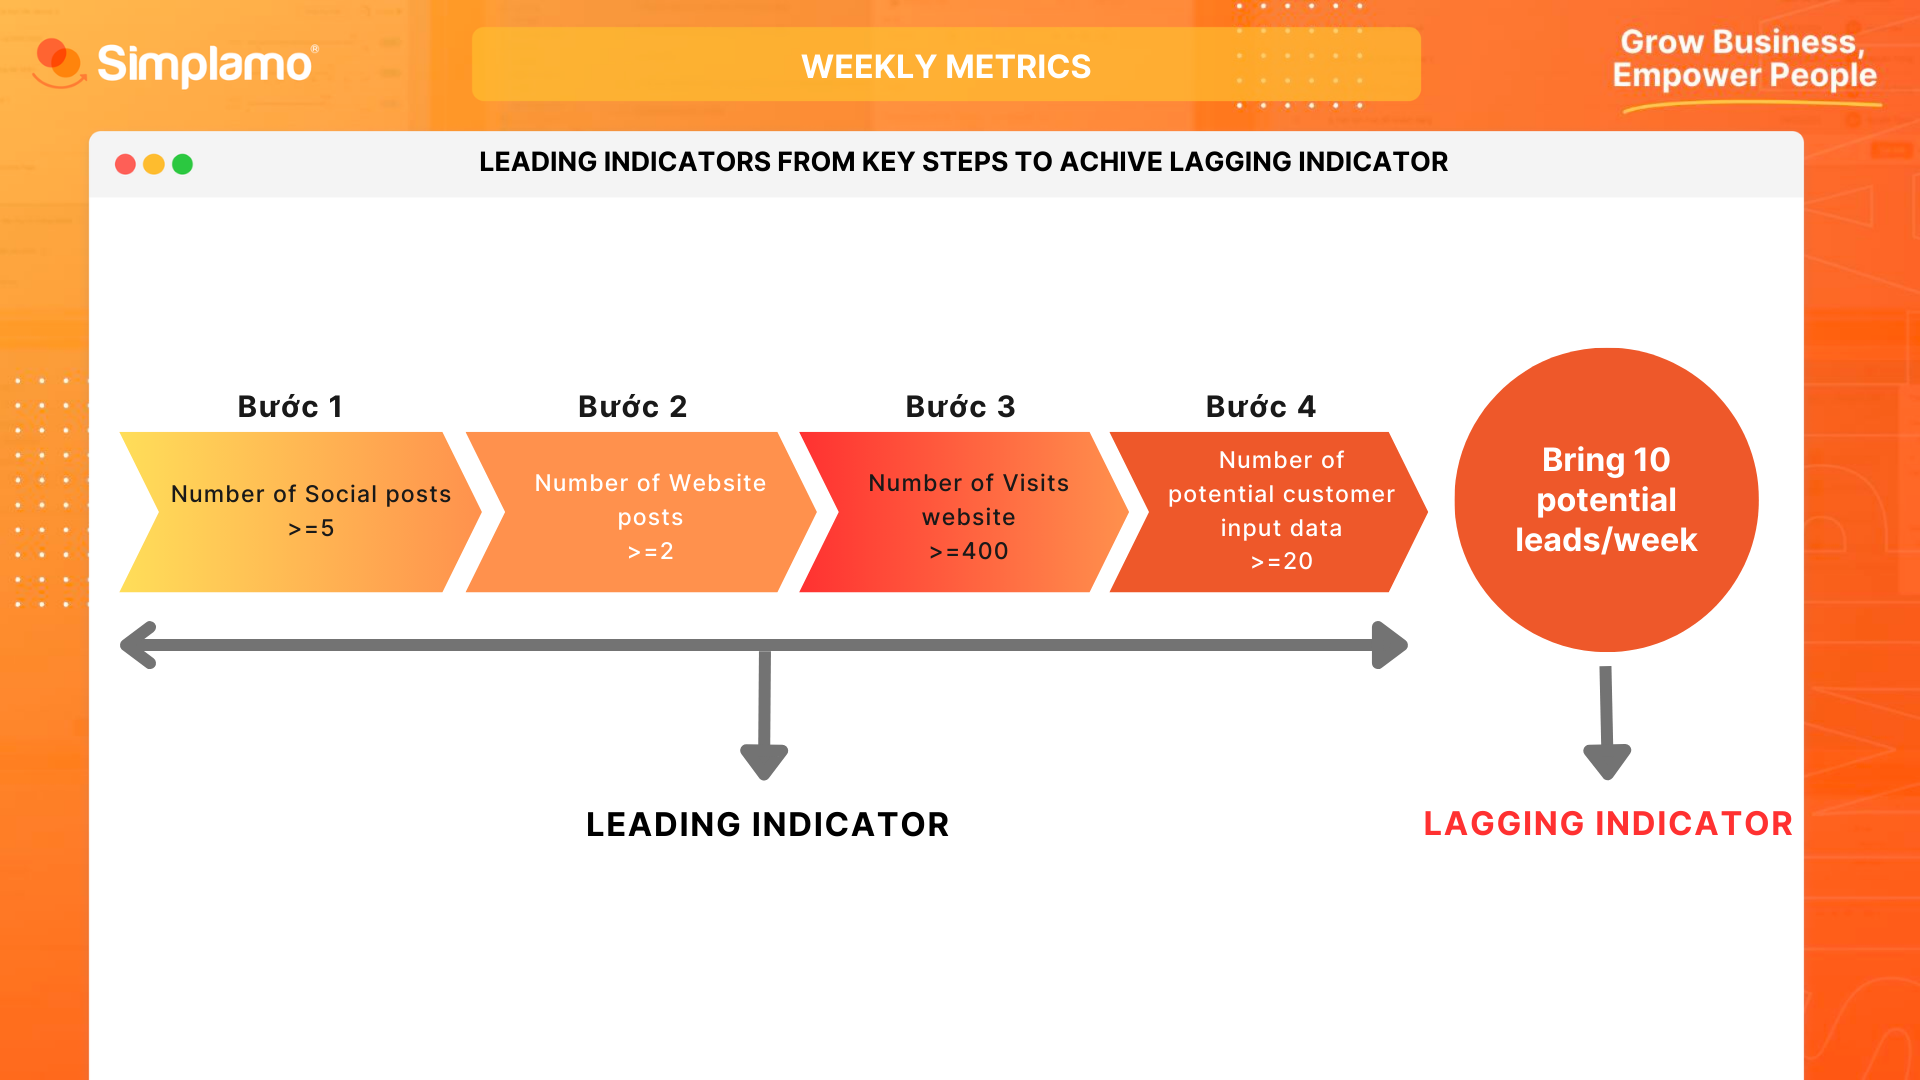
Leading Indicators to achieve "Bringing 10 potential leads per week"
V. 5 Steps to Build a Metrics
Step 1: Determine Lagging Indicators
For each individual in a weekly meeting, quantify their roles on the organization chart. These are the lagging indicators for each person.
Begin with the leadership team to identify the Company Metrics first.
Step 2: Create Leading Indicators
Create leading indicators from key steps in the work process (the steps to achieve the lagging indicators).
Step 3: Shorten the List
Discuss and narrow down the list of indicators, choosing which ones will be measured weekly at the company level and which ones at the department level (including both lagging and leading indicators).
Quantity: Adhere to the principle of "Less is More."
- 5 to a maximum of 15 indicators for the company level
- 3 to 5 indicators for the department level.
Examples:
- Number of successful customer demo sessions
- Number of delivery errors
- Number of website visits
- Amount of debt collection
- Number of customer complaints
- Average time to handle complaints
- ...
Step 4: Set Targets
Set targets for each indicator.
For revenue-related data, it should be derived from the data in the Business Vision Sheet - Focus page.
Step 5: Determine the Owner
Determine ownership for each indicator based on their role on organization chart.
For the scorecard to be effective, each individual must actively take responsibility for their indicators to ensure accuracy.
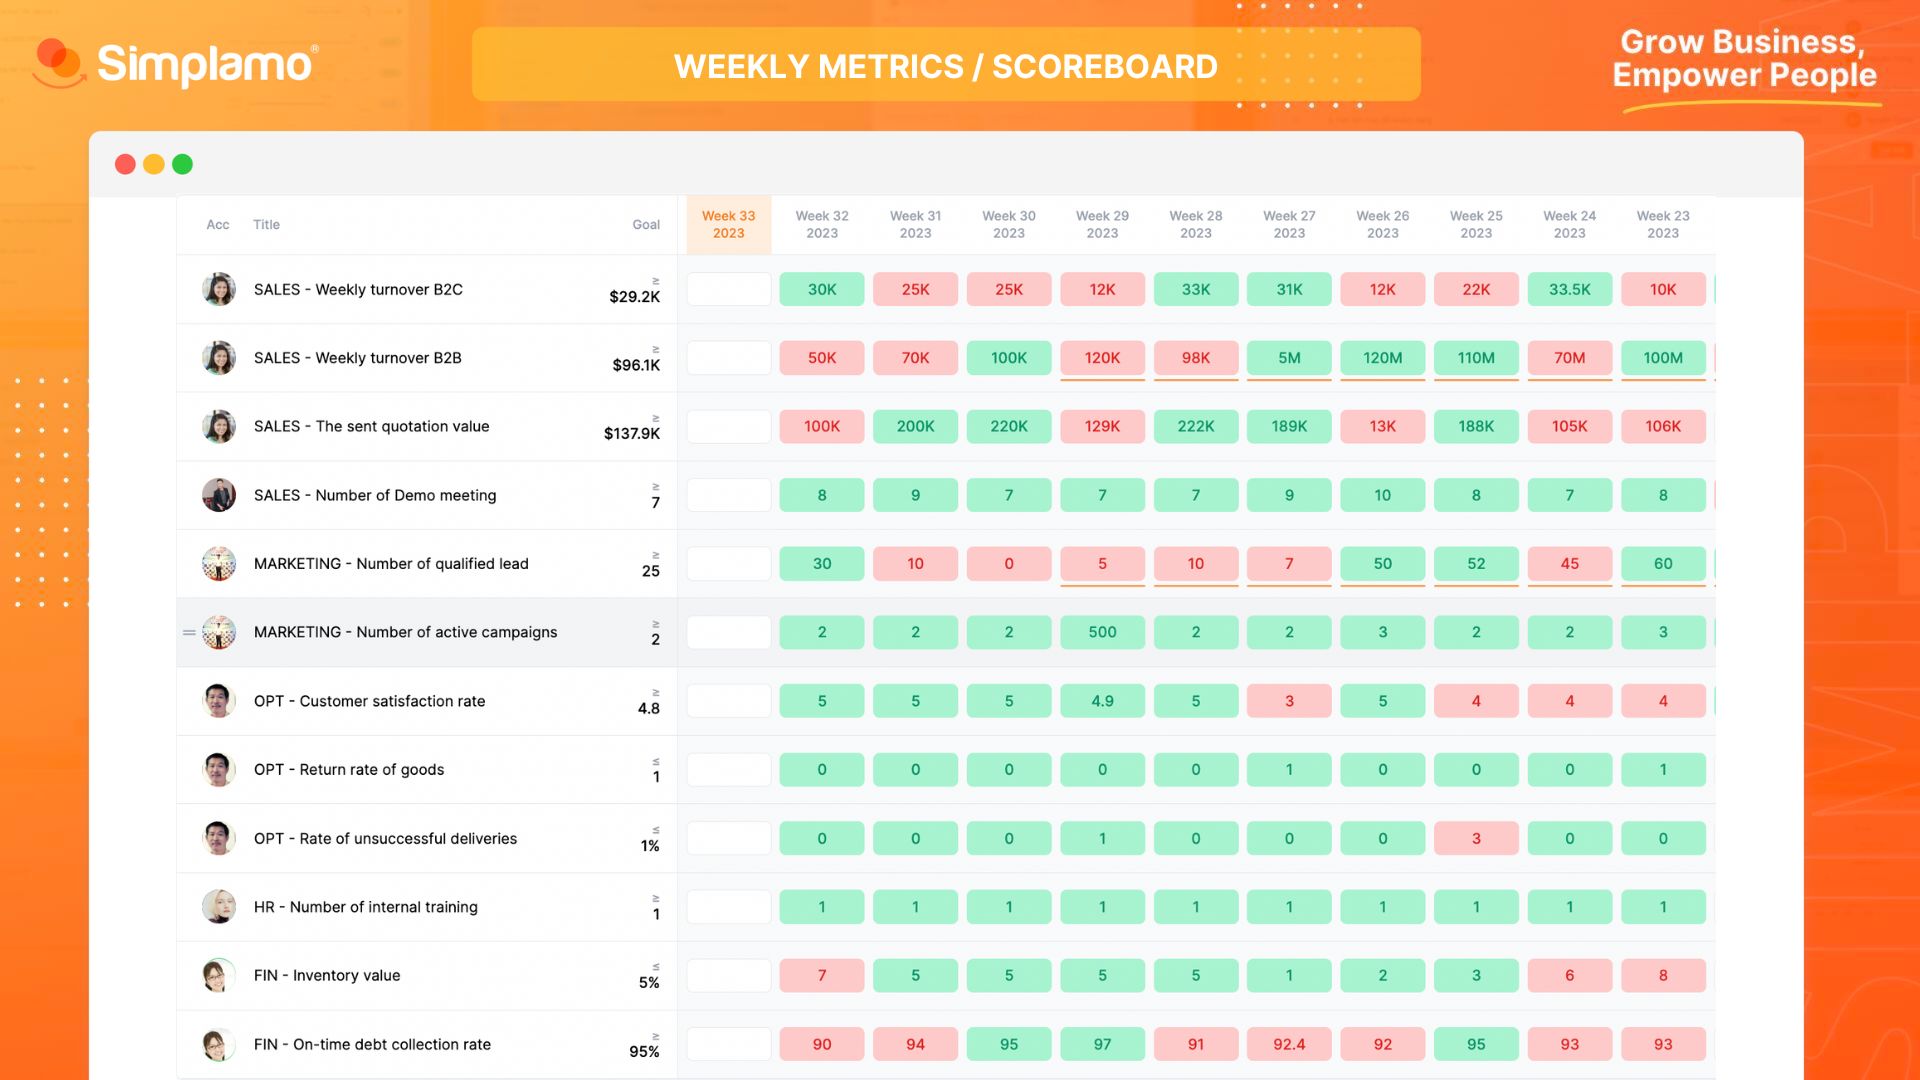
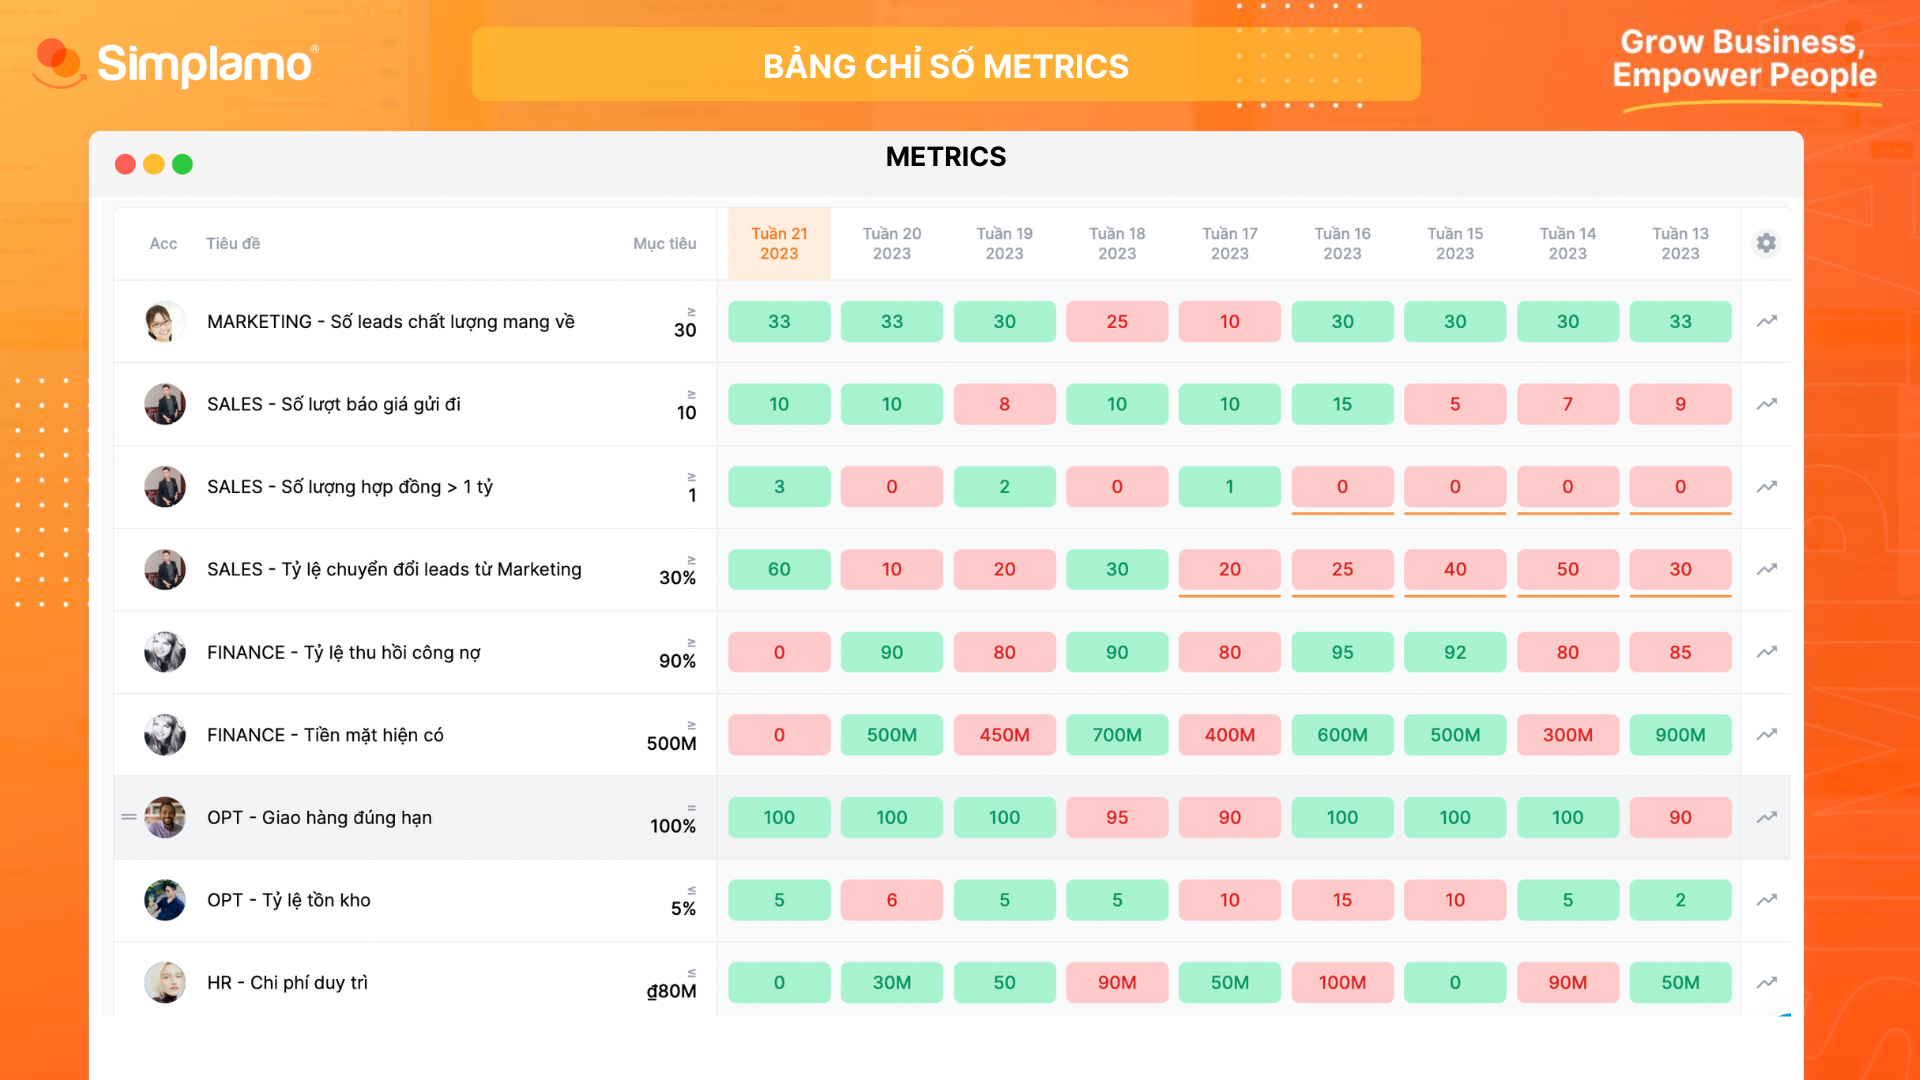
A Simplamo METRICS would be presented as picture below where is in green color mean that "hit weekly goal", in contrast mean that "didn't hit the goal".
So you have learned how to build a Metrics on sImplamo.
Once you have a clear and assured list of indicators, you will be able to capture the business pulse of your company and its forecasting ability. Naturally, it will lead to opportunities for all employees to have meaningful numbers guiding their work.